Crashes, No Sound, or Screen Glitches?
Random freezes, missing sound and display glitches usually trace back to one bad driver. Find and replace yours safely.Free scan · under a minutePC Slower Than It Used to Be?
A free scan shows the junk files, broken settings and background clutter dragging Windows down - then fixes them in one click.Free scan · Windows 10 & 11Data centers can put substantial demand on electricity systems, use water for cooling, add noise near a site, and contribute to air pollution and greenhouse-gas emissions. The scale of each effect depends on the facility’s location, design, operations, and reporting boundary; there is no single “typical” impact figure that describes every site.
How much electricity does a data center use?
Data centers consume electricity to run computing, storage, and networking equipment, as well as cooling and electrical infrastructure. Their demand can be concentrated in particular regions and may run around the clock. That combination matters to utilities and nearby communities: the relevant issue is not just annual energy use, but also where the load is located, how quickly it is growing, and what power the grid can reliably supply when the facility needs it.
As an Amazon Associate I earn from qualifying purchases.
Recent estimates describe different geographies and time periods, so they should not be treated as interchangeable or as measurements of an individual building.
The Tool Desk
Outbyte PC Repair FREERepair Windows errors before they cause bigger problemsFix Now →Outbyte Driver Updater FREEFix the driver behind crashes, sound loss and screen glitchesFind Drivers →| Estimate | Scope and meaning |
|---|---|
| 485 TWh in 2025; 950 TWh projected for 2030 | The International Energy Agency’s 2026 global estimate and projection for data-center electricity consumption. The 2030 figure is about 3% of global electricity demand. |
| 17% growth during 2025 | IEA estimate of year-over-year growth in global data-center electricity consumption. |
| Up to 9% of U.S. electricity generation by 2030, compared with 4% of total U.S. load in 2023 | An Electric Power Research Institute estimate cited by the U.S. Department of Energy in 2025. The 2030 figure is an upper estimate, not a measured outcome; its wording and denominator differ from the 2023 comparison. |
| 14% growth from 2023 to 2024 | Lawrence Berkeley National Laboratory’s 2025 estimate of the increase in U.S. data-center electricity use. It is a national estimate, not a description of every facility. |
The global IEA figures show both the scale and the forecast nature of the issue: the 2030 number is a projection, not a count of electricity already consumed. The U.S. figures likewise have distinct bases. In particular, “share of electricity generation” and “share of total load” are not identical measures, and an upper estimate for 2030 should not be read as a guaranteed result. The DOE notes that large, rapidly increasing loads can affect regional grids and that data centers often need firm power around the clock.
#1 Best Overall

- Condition: 100% Brand New and in Perfect package to ensure you receive a perfect product
- Model: DV4600-492
- Bearing Type: Ball; Fan Diameter: 120mm; Maximum Fan Speed: 2650/3100 RPM; Material: Plastic; Type: Axial cooling fan
- Packaging: Carton; Power Connection: 2-Pin; Voltage: 115VAC
- Fan size: 120*120*38MM
What matters when evaluating a particular facility
Ask for annual electricity use and peak demand for the same reporting year. Annual use indicates energy consumed over time; peak demand helps show the maximum load the facility places on the system. Check whether a reported number covers only information-technology equipment or the whole facility, including cooling and electrical losses. A comparison that mixes those boundaries can make one site appear more or less energy-intensive simply because the accounting differs.
Also distinguish actual use from planned capacity or forecast demand. A proposed campus, a permitted maximum, and an operating facility’s measured annual consumption are different things. For a local grid discussion, the facility’s location and expected timing of demand growth matter alongside the headline annual figure.
Do data centers use a lot of water?
Some data centers use water directly as part of cooling, while others use cooling approaches that may consume much less on site. The amount depends on facility size, computing density, cooling design, and local conditions. Evaporative cooling systems and cooling towers lose water as heat is rejected, so they need makeup water. The presence of a data center alone does not establish how much water it uses or whether that use is locally consequential.
Quick wins for a faster PC:
Scan for outdated or missing drivers - takes under a minuteDriver Scan →Clear out junk files and repair common Windows errorsFree Scan →Fix the driver behind crashes, sound loss and screen glitchesFind Drivers →Rank #2

- APPLICATION: USB computer fans cool off gaming systems, routers, amplifiers, and receivers. 120mm case fan keep entertainment centers' stereos and cables cool and help with air flow in various spaces
- PLAY AND PLUG: Just plug this server fan into any USB source—like a charger, power bank, phone adapter, game console, or USB outlet. It's a breeze to use
- PACKAGE INCLUDING: This usb cooling fan set comes with two USB fans, one USB cable to control two fans (high speed medium speed low speed), and a metal shield to protect your hands. Easy to use, safe and reliable
- Variable Speed Fan: It has a variable-speed controller so you can adjust the pc fan for the best mix of quiet operation and airflow
- Specification: 120 x 120x 25 mm ( 4.72 x 4.72 x 0.98 in. ) | Rated Voltage : 5V | Rated Current: 0.25A | Airflow: 77 x 2 CFM | Noise: 32dBA | Speed: 2000 RPM (MAX)
The U.S. Department of Energy’s Federal Energy Management Program (FEMP) explains that water consumed in cooling-tower systems is directly related to the heat load and the efficiency of heat-removal steps. FEMP defines water usage effectiveness, or WUE, as annual site water use in liters divided by annual IT equipment energy use in kilowatt-hours. A WUE figure can help compare sites when the year, measurement boundary, and calculation are consistent. It does not, by itself, say whether the water source is scarce, whether consumption occurs during a drought-sensitive period, or how much water was used to generate the facility’s electricity.
How to interpret water comparisons
- Separate withdrawal from consumption. Water taken from a source and then returned is not the same measure as water consumed through evaporation or otherwise not returned locally. A report should state which measure it uses.
- Identify the source. Potable municipal supply, reclaimed water, and other sources have different implications for competing users and local infrastructure.
- Match WUE boundaries. Confirm that the reported water use and IT energy cover the same site and period; otherwise the ratio is not a like-for-like comparison.
- Consider the watershed. A volume that is manageable in a water-abundant area may be more consequential in a water-stressed basin. WUE does not replace local water-stress context.
Virginia’s Joint Legislative Audit and Review Commission (JLARC) found that water consumption varies with facility size, computing density, and cooling type. Its Virginia-specific assessment says most data centers in the state use about as much water as or less than an average large office building, while a few use substantially more and some use less than a typical household. Those findings are not a national average and do not settle the implications of a facility in a water-stressed region elsewhere.
Can cooling towers use less water?
FEMP describes one system-specific efficiency example: for applicable cooling towers, increasing cycles of concentration from three to six can reduce makeup-water requirements by 20% and blowdown by 50%. This is not a promised saving for every facility. It applies to cooling-tower systems where the operating conditions and water chemistry allow the change; it should not be applied as a blanket estimate for data centers with different cooling designs.
Rank #3

- An ultra-quiet UL-certified fan system designed for cooling cabinets that requires minimal noise.
- Features a multi-speed controller to set the fan’s speed to optimal noise and airflow levels.
- Contains a CNC machined aluminum frame with a modern brushed black finish.
- Powered by wall outlet or USB port, included Turbo Adapter increases performance by 25%.
- Dimensions: 8.5 x 4.4 x 1.3 in. | Total Airflow: 52 CFM | Total Noise: 18 dBa | Bearings: Dual Ball
Are data centers noisy?
Noise is a legitimate planning and community concern, but available evidence does not support a single representative decibel level for data centers or a universal setback distance. Equipment-level sound figures are not equivalent to sound measured at a home or other receptor. The level experienced at a property can depend on the equipment, its operating condition, distance, barriers, the surrounding environment, and how the sound is measured.
The Scottish Government’s 2026 planning direction includes noise among the location-specific impacts that may arise from data-center development. That is a planning context for Scotland, not a universal noise rule. Applicable limits and permit conditions depend on the jurisdiction and the particular site.
What to request in a noise assessment
- Measurements or modeling at the property line and at other relevant nearby receptors, not only beside individual equipment.
- The operating conditions represented, including whether the facility is at normal load or using equipment that runs only under particular conditions.
- Measurement timing and treatment of tonal or low-frequency sound, where relevant.
- The applicable local ordinance, planning condition, or permit limit, and how the assessment compares with it.
A sound assessment is most useful when it states its measurement locations and operating assumptions clearly. Without those details, a decibel number may not tell a neighbor what sound to expect at a particular place or time.
Rank #4
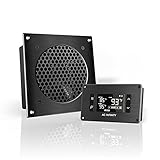
- An ultra quiet UL-certified fan system designed for cooling cabinets that requires minimal noise.
- Features an on board processor that provides a digital read-out of the cabinets temperatures.
- Programming includes thermostat control, fan speed control, and SMART energy saving mode.
- Dimensions: 6.3 x 6.3 x 1.3 in. | Airflow: 52 CFM | Noise: 18 dBA | Bearings: Dual Ball
Do data centers cause air pollution and greenhouse-gas emissions?
There are two distinct pathways. First, the electricity a data center consumes can lead to indirect greenhouse-gas emissions at the power plants supplying the grid. The amount depends on the generation mix and the accounting method used. Second, on-site engines or combustion turbines used for primary or backup power can produce direct emissions where they operate. These pathways should be reported separately rather than combined without explanation.
The IEA’s 2025 Energy and AI analysis estimates that data centers account for around 180 million tonnes of indirect CO2 emissions from electricity consumption, excluding backup generation. In that analysis, the estimate is about 0.5% of global combustion emissions. Those are global estimates with a specific exclusion; they do not describe the emissions of a particular site or include all possible on-site sources.
Why location and accounting matter
Electricity-related emissions vary across grids and over time. For the United States, the Environmental Protection Agency’s eGRID provides power-plant emissions and generation data aggregated at state and grid-region levels. It can help explain why the same electricity use may be associated with different emissions in different places. Any comparison using eGRID should identify the dataset year and the grid region, and it should explain the emissions rate or accounting method applied.
Best Value
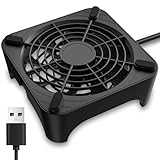
- 【Universal Compatibility】This USB cooling fan works seamlessly with Mini PC, PS5, routers, Apple TV, modems, PlayStation, receivers, Rokus, T-Mobile 5G Home Internet, Xbox Series, and other audio-video electronics. Whether cooling a gaming console, router, or streaming device, it eliminates overheating worries across your digital ecosystem.
- 【Powerful Cooling Performance】Equipped with a 120mm fan boasting 55.8 CFM airflow and 850RPM±10% speed, this USB PC fan delivers rapid cooling—dropping device temperatures by 20% in seconds. The 9-blade design ensures powerful airflow to tackle heat buildup in routers, mini PCs, and gaming consoles, preventing lag and performance drops caused by overheating.
- 【Ultra-Quiet Operation & Scratch-Proof Protection】 Designed for ultra-quiet and scratch-resistant cooling needs, this USB computer fan comes with 4 shock-absorbing pads and operates at just 18dB(A)±10% noise—whisper-quiet, quieter than library silence (30dB) and close to the sound of rustling leaves (20dB). It enables efficient device cooling without noise interference or surface scratches, letting you fully immerse in video, audio, and gaming. It’s perfect for home offices, living rooms, and gaming setups.
- 【USB-Powered & Space-Saving Setup】This USB powered fan features an integrated 530mm (20.87-inch) USB cable, connecting easily to chargers, mobile power banks, or laptops—no extra wires needed. With dimensions of 130mm×130mm×48.6mm (5.12×5.12×1.91 inches), it can be placed flat or upright, making it perfect for narrow spaces while keeping your setup tidy.
- 【Sturdy & Long-Lasting Durability】Made from premium eco-friendly ABS material, this USB fan (with a box fan-like structure) supports heavy-duty use and can withstand weights up to 11LB. With a lifespan of 40000 hours, it offers long-term cooling for your devices, ensuring stable performance and protection against overheating for years to come.
A company’s contractual clean-energy claims and a location-based grid estimate may use different accounting approaches. They answer different questions, so a fair comparison should state the method rather than presenting one figure as the only possible measure. For a facility-level assessment, look for the electricity consumption year, grid region, emissions factor and its year, and whether the figure covers only purchased electricity or also direct on-site combustion.
What about backup generators?
Stationary engines and combustion turbines can emit air pollutants when they run, including when used for backup power. The EPA identifies Clean Air Act standards that may apply to stationary engines and turbines. Whether a specific standard applies depends on the equipment and regulatory circumstances; operating hours and permit conditions also matter. The existence of backup generators does not establish that they run continuously, so ask for the equipment type, permitted operating conditions, and actual or expected operating profile before drawing conclusions about local emissions.
Independent reader supportYour contribution helps us test, update, and keep practical guides available for everyone.How can two data centers be compared fairly?
Start by matching boundaries, geography, and year. A projection should not be compared as though it were an observed result, and a whole-building figure should not be compared directly with an IT-only measure. For community review, request the following information for each site:
| Impact area | Information to compare |
|---|---|
| Electricity | Annual use, peak demand, measurement year, and whether the figure covers IT equipment or the whole facility. |
| Water | Direct water consumption, source, cooling design, WUE definition and boundary, reporting year, and local water-stress context. |
| Emissions | Grid region and emissions dataset year; indirect grid emissions separate from direct combustion; whether backup generation is included. |
| Noise | Measured or modeled level at the property line or receptor, time and operating condition, treatment of tonal or low-frequency sound, and applicable local limits. |
| Evidence quality | Whether results are measured or projected, the reporting boundary, and whether the figures have been independently verified. |
This framework does not produce a single score, because the impacts are not interchangeable. A site with lower direct water consumption may still warrant scrutiny if it is in a stressed watershed; a low-emissions electricity claim may rely on a different accounting boundary from a grid-based estimate. Comparisons are most informative when the underlying dimensions remain visible rather than being collapsed into one “green” label.
What should a community ask during planning?
Questions are most useful when they elicit site-specific evidence rather than a generic industry average. Depending on local concerns and the stage of a proposal, residents and decision-makers can ask:
- What are the facility’s expected annual electricity use and peak demand, and which figures are forecasts versus operating measurements?
- Does the electricity estimate include cooling and other facility systems, or only IT equipment?
- What cooling system is proposed, how much water is expected to be consumed, and what source will supply it?
- What WUE definition, site boundary, and reporting period support any water-intensity claim?
- What local watershed or water-supply context is used to assess that consumption?
- What equipment produces on-site emissions, what permits apply, and how often is it expected or authorized to run?
- What grid emissions data and year support any indirect-emissions estimate?
- Where will noise be assessed, under what operating conditions, and against which local criteria?
- Are the figures independently verified, and will results be reported after the facility begins operating?
Answers should distinguish measured performance from modeled expectations and say what is included. If a proposal offers a single number without its year, boundary, location, or method, it is difficult to interpret or compare responsibly.
Quick Recap
Product prices and availability are accurate as of the date/time indicated and are subject to change. Any price and availability information displayed on Amazon at the time of purchase will apply.