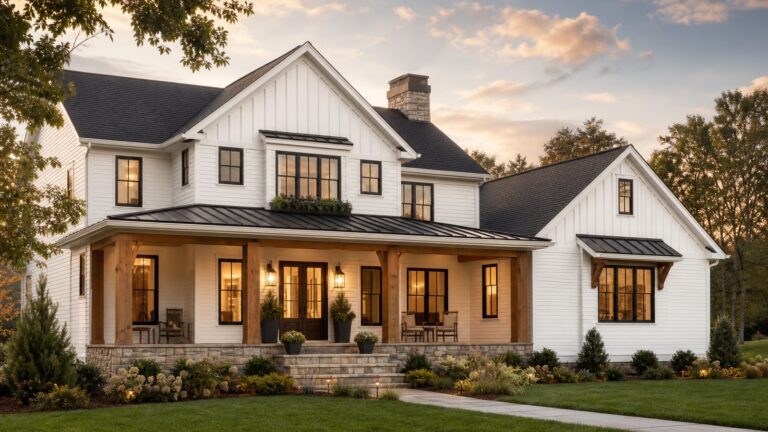
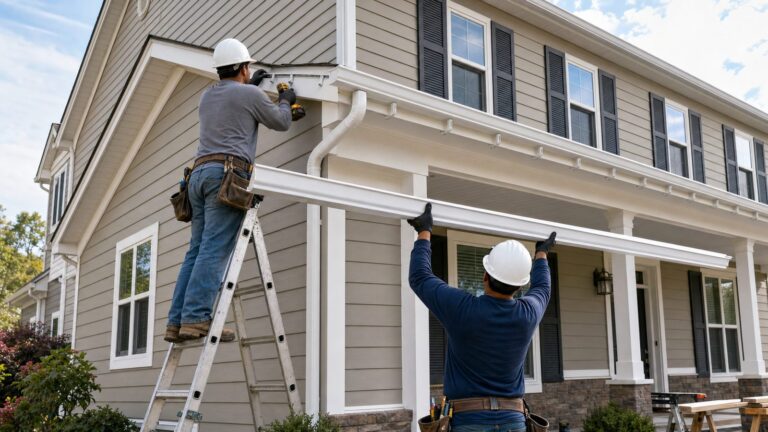
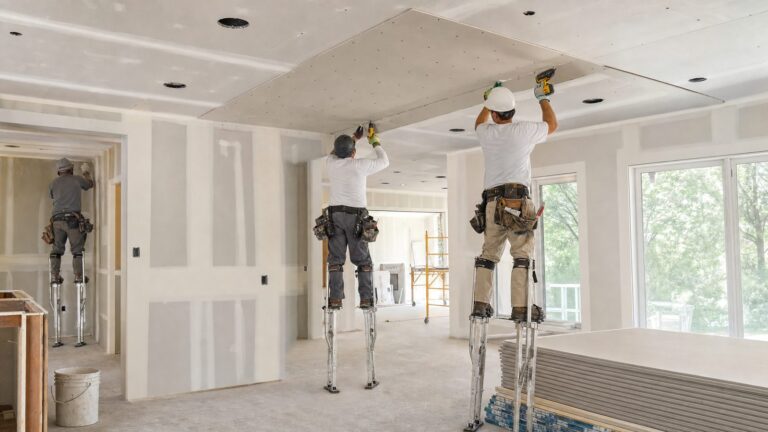
For U.S. new single-family homes, construction cost is driven by the work required to build the house—materials and labor across foundations, framing, systems, finishes, and other stages—plus site conditions, fees, and professional services. It is not the same as the finished lot’s price or the final sale price, which can also include financing, overhead, marketing, commissions, and builder profit. National figures are useful orientation, not a price quote for a particular home: costs, permit systems, building codes, and construction practices vary by location.
What does “construction cost” include?
The National Association of Home Builders’ 2025 report, based on a survey of homes built during 2024, put average construction cost at $428,215, or 64.4% of the average $665,298 sale price. The same survey listed the finished lot separately at an average $91,057, or 13.7% of sale price. Its usable sample was 41 builders after examination and outlier analysis, so these are national survey averages, not a quote or guaranteed budget for an individual home. NAHB’s 2024 construction-cost report cautions that it is not a perfect tool for estimating a particular house in a particular location.


As an Amazon Associate I earn from qualifying purchases.
Sale price and construction cost answer different questions. A builder’s construction estimate may not include land acquisition, financing, general overhead, marketing, sales commissions, or profit. Check the scope before comparing an estimate with a home’s sale price.
Quick wins for a faster PC:
Repair Windows errors before they cause bigger problemsFix Now →Scan for outdated or missing drivers - takes under a minuteDriver Scan →Which building stages account for the largest shares?
In NAHB’s survey of homes built during 2024, the largest reported construction-cost shares were interior finishes, major systems rough-ins, and framing. Percentages below are shares of construction cost, not shares of sale price.
#1 Best Overall
| Construction category | Share of construction cost | What it covers in NAHB’s classification |
|---|---|---|
| Interior finishes | 24.1% | Interior finish work and materials |
| Major systems rough-ins | 19.2% | Plumbing, electrical, and HVAC rough-ins |
| Framing | 16.6% | Roof framing, trusses, sheathing, and general metal/steel |
| Foundations | 10.5% | Includes excavation, foundation, concrete, retaining walls, and backfill; excavation, foundation, concrete, retaining walls, and backfill are reported as 10.0% in the detailed breakdown |
| Site work | 7.6% | Permits and fees, water/sewer fees and inspections, architecture and engineering, and other site work |
These are the categories and shares in the NAHB 2024 cost breakdown. A project estimate may group the same tasks differently. For example, landscaping, driveways, and outdoor structures appear under final steps in that survey, rather than site work.
How do materials and labor affect the bill?
Materials and labor are embedded in each construction stage rather than presented as one universal materials-versus-labor split. NAHB says its cost categories include labor paid directly by the general contractor, subcontractor expense, and materials, regardless of how the materials were purchased. A framing figure, for example, reflects the work category rather than a materials-only price.
Rank #2

- Books
- Log Homes
- Building
- Construction
The U.S. Census Bureau’s construction-spending definition is broader than a homeowner’s materials receipt: construction value can include installed materials and labor, a proportionate share of equipment rental, contractor profit, architectural and engineering work, overhead, and certain interest and taxes. Land acquisition is separate. The Census definition describes “value of construction put in place” as the value of construction installed or erected at a site during a given period; it is an accounting measure, not a contractor’s quote. Census Bureau construction-spending definitions
What do permits, fees, and regulation add?
Ordinary permit and utility-related fees are only part of the broader costs associated with regulation. In NAHB’s 2025 survey of homes built during 2024, site work accounted for 7.6% of construction cost. Within that grouping, building permit fees represented 1.8%, impact fees 1.5%, water and sewer fees or inspections 1.5%, architecture and engineering 1.5%, and other site work 1.4%. These are national survey shares, not a standard fee schedule for every jurisdiction.
Rank #3
NAHB’s separate 2026 regulation study estimated regulatory costs at 26.4% of a modeled final house price, or $131,734. That estimate draws on industry surveys conducted in March 2026 and converts the estimated costs using a $499,500 average new-home price from the January 2026 Census/HUD report. It spans more than permit bills: the study includes zoning approvals and studies, compliance costs, land dedication, development standards, permit, inspection and utility fees after lot purchase, building-code changes, architectural design standards, labor requirements, and delays. NAHB reported that 92.0% of responding builders paid fees during construction; across surveyed homes, those fees averaged 6.4% of construction costs and 4.0% of final home price. The total is specific to the study’s captured categories, survey basis, and conversion assumptions—not a universal add-on for an individual home. NAHB’s 2026 regulation-cost study
Why can site work vary so much?
Site work is not just excavation. Depending on the estimate’s classification, it can include permits and impact fees, water and sewer charges or inspections, design and engineering, utility connections, and other site-preparation work. The Census construction-spending definition includes site preparation and outside fixed facilities such as utility connections. NAHB’s home-cost survey, meanwhile, groups certain fees and professional services under site work but lists foundations separately.
Physical conditions and access can also change what a site requires. When seeking an estimate, identify slope, soil, access, demolition, grading, drainage, and utility-connection assumptions. Do not assume two bids use the same definition of “site work.”
How should you compare estimates for a house?
Ask each builder or estimator to price the same scope before comparing totals. Differences in assumptions can make two numbers look comparable when they do not cover the same work.
Best Value
- Match location and jurisdiction. Specify the project address or permit jurisdiction so local codes, fee schedules, and labor conditions can be considered.
- Match house size and specifications. Align finished floor area, design, structural requirements, and materials and finish selections.
- Describe the site. Document slope, soil information, access, demolition, grading, drainage, and utility connections.
- Align contractor and subcontract scopes. Confirm which labor, equipment, and subcontracted work are included.
- List every inclusion and exclusion. Check permits, impact and utility fees, design and engineering, overhead, financing, allowances, contingency, and land.
These comparison points follow from the cost categories NAHB and the Census Bureau define; they are not a published ranking of which factor changes a price most. A local builder, estimator, architect, or engineer can account for a particular site and jurisdiction. Validate the professional’s qualifications and clarify any commercial relationship before relying on an estimate.
Can Census data tell you what a home will cost?
No. Census permit counts measure construction authorizations, not permit prices or the cost of a specific home. The Building Permits Survey offers monthly, year-to-date, and annual statistics at national, state, metropolitan, county, and local levels; its 2025 annual permit estimates were released May 14, 2026. They can show construction activity in an area, but they do not set the fee for your project. U.S. Census Bureau Building Permits Survey
Likewise, the Census Bureau reported private residential construction spending at a seasonally adjusted annual rate of $882.3 billion in August 2026, up 1.1% from revised July. This is aggregate spending across projects, not a per-house price index or a forecast of an individual build. U.S. Census Bureau construction spending
Do these 3 things before closing this tab:
1Fix the driver behind crashes, sound loss and screen glitches2Repair Windows errors before they cause bigger problems3Scan for outdated or missing drivers - takes under a minuteQuick Recap
Product prices and availability are accurate as of the date/time indicated and are subject to change. Any price and availability information displayed on Amazon at the time of purchase will apply.