Windows Errors? Fix Them Before They Spread
Repair common Windows errors and clear accumulated junk for a smoother, more stable PC - no reinstall needed.Free scan · no reinstallCrashes, No Sound, or Screen Glitches?
Random freezes, missing sound and display glitches usually trace back to one bad driver. Find and replace yours safely.Free scan · under a minuteNeither utility-scale solar nor offshore wind is universally cheaper or faster. A defensible choice depends on the same dollar year, plant boundary, financing case, grid scope, resource quality and delivery milestones being used for both options. NREL’s 2024 Electricity Annual Technology Baseline (ATB) supplies a common modeling framework, but its figures describe defined plants and scenarios—not firm bids or universal market prices.
For a clear reference point, NREL models a 100-MWdc, one-axis-tracking utility photovoltaic plant at $1.56 per Wac in 2023 overnight capital cost, including grid connection. Offshore-wind economics vary much more directly with water depth, waves, wind conditions, distance to ports and interconnection, vessel availability and supply-chain maturity. The practical answer is therefore a disciplined, project-specific comparison rather than a single technology ranking.
As an Amazon Associate I earn from qualifying purchases.
What is being compared?
Utility-scale solar photovoltaic generation
Utility-scale solar uses large arrays of photovoltaic modules, commonly with fixed-tilt or single-axis tracking structures, inverters, collection equipment and a substation. The plant converts sunlight into electricity during daylight hours. Output follows the solar resource and the chosen design, so a project’s capacity factor, annual production profile and need for firming or storage depend on location, tracking, module orientation, clipping assumptions and the grid’s ability to absorb midday generation.
Do these 3 things before closing this tab:
1Fix the driver behind crashes, sound loss and screen glitches2Repair Windows errors before they cause bigger problems3Scan for outdated or missing drivers - takes under a minuteCost figures can be quoted on a direct-current (DC) or alternating-current (AC) basis. A DC rating describes the module field; an AC rating describes the inverter and grid-facing output. Mixing those bases can make an apparently cheaper project look comparable when it is not. Interconnection scope, land preparation, collector systems, taxes, storage and financing can also move the total substantially.
#1 Best Overall

- Valued Carpenter Pencil Set: You will get 2 pcs solid carpenter pencils with 26 piece 2.8 mm refills, 1 replaceable sharpener, 1 plastic storage box.The complete carpenter pencils combination allows you to finish your work faster and more easily
- Deep Hole Marker Pencil: The deep-hole construction pencils adopts 45mm elongated tip design, which is more convenient to mark in the small hole or in other tight areas that other carpenter markers cannot reach
- Carpenter Pencils with Sharpener: The sharpener is screwed into the top of the work pencil, which won't get lost either. Built-in pencil sharpener that keep the lead with pointed and smooth to Improves line of sight in fine work
- Stronger Solid Lead: This work pencil is matched with a 2.8 mm thick lead , which is much thicker and stronger during the drawing process of construction work, it will not break or damage easily
- Marks on Various Surfaces: 3 colors solid construction pencil can marks on various surfaces,such as metal, plastic, wood, paper etc. Ideals for woodworkers, contractors, craftsmen, builders, merchants and masons
Fixed-bottom and floating offshore wind
Offshore wind uses turbines installed in marine environments, submarine export cables, offshore substations and onshore interconnection facilities. Fixed-bottom turbines are attached to the seabed and are the more established commercial configuration. Floating turbines use platforms moored in deeper water; NREL treats large-scale U.S. floating deployment as nascent and begins its modeled gigawatt-scale cost estimates in 2030.
Wind output can continue through night-time hours and may complement solar’s daily production pattern, but the energy profile is determined by the wind regime at the exact lease area. Marine access, weather windows, corrosion protection, cable routes, port capacity and specialized installation vessels affect both construction and long-term operations.
The fair-comparison rules
A cost comparison is meaningful only when the inputs describe equivalent boundaries and assumptions. NREL’s ATB is useful because it applies a consistent framework across technologies, resource conditions and financial cases, but the result remains a modeled estimate for a defined plant.
The Tool Desk
Outbyte PC Repair FREERepair Windows errors before they cause bigger problemsFix Now →Outbyte Driver Updater FREEFix the driver behind crashes, sound loss and screen glitchesFind Drivers →| Comparison item | Utility-scale solar | Offshore wind | What must be aligned |
|---|---|---|---|
| Capital cost | State DC or AC rating, tracker design, modules, inverters, land works and whether interconnection is included. NREL’s representative benchmark is a 100-MWdc, one-axis-tracking system. | State turbine size and count, foundation or floating platform, array and export cables, offshore substation, ports, vessels and onshore works. | Use the same dollar year, project boundary, capacity convention and treatment of transmission, taxes and development costs. |
| Operating cost | Include scheduled maintenance, inverter and tracker servicing, vegetation control, replacement reserves, insurance and land costs where applicable. | Include marine inspection, vessel and helicopter access, corrosion control, cable maintenance, port logistics, insurance and major-component replacement. | Compare annual and lifetime O&M in the same price year and escalation convention. |
| Energy output | Use the site’s solar resource, tracking configuration, losses, degradation and modeled capacity factor. | Use the site’s wind-speed distribution, wake losses, availability, turbine power curve, waves and weather-related access limits. | Compare modeled lifetime megawatt-hours, not nameplate capacity alone. |
| LCOE | Reflect the selected resource, capacity factor, capital structure, debt terms, taxes, incentives and operating life. | Reflect the same financial assumptions plus marine construction risk, vessel costs and site-specific production. | Never use one LCOE figure as a substitute for the underlying CAPEX, O&M, output and financing assumptions. |
| Delivery risk | Consider module and inverter procurement, civil works, interconnection queues, design changes and the timing of a power-purchase agreement. | Consider seabed and metocean conditions, permitting, vessels, ports, cables, inflation, interest rates and supply-chain bottlenecks. | Compare equivalent milestones in the same jurisdiction and project scope. |
What the published solar benchmark actually says
NREL’s 2024 ATB utility-PV case
NREL’s 2024 ATB models a 100-MWdc, one-axis-tracking utility-PV plant. Its stated 2023 overnight capital cost is $1.56/Wac, including grid connection. The figure is a modeled benchmark, not a quoted engineering, procurement and construction price, a project bid or a universal 2023 market price. The AC unit matters: converting it to a DC figure without the model’s inverter-loading assumptions would create a false comparison.
The benchmark also represents a specific system design and cost boundary. A project using fixed-tilt arrays, a different DC-to-AC ratio, unusual terrain, long interconnection facilities, storage or additional transmission will not share the same cost. NREL notes that reported PV prices can differ because of timing, system design and the categories included in the accounting.
Rank #2

- Ergonomically Designed: Work in tight areas with a compact design that gets into tough spots
- Both tools are designed to fit into difficult to reach spaces
- Complete a wide range of applications with a high-performance motor that delivers up to 300 UWO, and an impact driver delivering up to 1,400 in-lbs of torque
- Both the DEWALT impact driver and drill driver feature integrated LED work lights with a convenient 20-second delay, ensuring enhanced visibility in dimly lit or challenging work areas
- One-Handed Loading - Keep one hand free with a 1/4 in. hex chuck that accepts 1 in. bit tips
DOE’s 2025 benchmark is a different case
The U.S. Department of Energy’s 2025 solar benchmark page presents a representative 100-MWdc PV system paired with 240 MWh of storage, expressed in 2024 U.S. dollars. That paired configuration should not be compared directly with NREL’s unpaired PV plant or with an offshore-wind generation-only figure. Storage adds batteries, power-conversion equipment, controls, augmentation and replacement assumptions; it also changes the hours and value of electricity delivered to the grid.
What the solar number does—and does not—answer
- It gives a transparent capital-cost reference for one modeled plant design.
- It does not establish the current price of every U.S. utility-PV project.
- It does not provide a generic construction duration; the available benchmark material does not support one universal solar schedule.
- It does not reveal a project’s annual energy output without the site resource, losses, degradation and capacity-factor assumptions.
- It does not include storage unless the selected benchmark explicitly does so, as in DOE’s separate 100-MWdc-plus-240-MWh case.
Why offshore-wind costs vary so widely
Site and marine conditions
NREL’s offshore-wind methodology evaluates thousands of potential U.S. sites and incorporates wind profiles, water depth, waves, distance to ports and distance to grid interconnection. Those variables influence foundation or platform design, cable length, installation methods, weather downtime, vessel requirements, annual energy production and the cost of routine access.
Two projects with the same turbine rating can therefore have materially different economics. A shallow, nearshore fixed-bottom site with an available port and short export route is not equivalent to a deep-water site requiring floating platforms, long mooring lines, new port infrastructure and extended cable routes. Any offshore LCOE must be labeled with its project and scenario rather than presented as a sector-wide price.
Economic shocks and contracting pressure
NREL’s 2023 edition of its offshore-wind cost analysis, published in 2024, describes cost pressure from commodity prices, inflation and higher interest rates. It also identifies limited installation-vessel availability as a sector bottleneck. When a power-purchase agreement was signed under earlier assumptions, some developers found that the revised equipment, financing and construction economics no longer worked and renegotiated or terminated offtake contracts.
These events do not determine every project’s outcome. They show why an offshore financial model needs explicit escalation, contingency, vessel availability, interest-rate and offtake assumptions, with sensitivity cases rather than one point estimate.
Rank #3

- 【Great Compatibility】This Katerk 1/4 inch hex shank bit holder is specifically designed for 1/4 inch hex shank drill bits. It's compatible with most 1/4 fast hex handles, hex sockets, various electric screwdrivers, and handheld screwdrivers. The bit holder makes it a valuable addition for any handyman.
- 【Secure and Safe】Built with a secure backup nut design, each drill bit holder securely locks onto your bits, ensuring they stay firmly in place. Additionally, our bit holder incorporates a high-quality steel ball rolling design that holds up to several kilograms of weight, ensuring your various drill bits don't fall off.
- 【Easy One-Handed Operation】The bit holder for impact driver allows you to change bits single-handedly, simplifying your workflow. Its multi-color design further allows for quick identification of the drill bit you need.
- 【Compact and Convenient】Thanks to its compact size, this 1/4 inch bit holder is easy to carry around. The bit holder allows for easy attachment to various tools, making this a convenient addition to your construction accessories. The Katerk bit holder is cast from high-quality alloy material, promising a long product lifespan. Despite its rugged strength, the bit holder remains lightweight, making it portable.
- 【Cool Christmas Gift For Men Stocking Stuffers】 This screwdriver bit holder, driver bit holder, impact bit holder, can be given as a gift to your loved one, especially for anyone involved in construction or electrical work. It's a must-have for stocking stuffers for men and women, tools gifts for dad, tech gadgets for men, gifts for dad, gifts for him, gifts for husband, gifts for boyfriend, cool gadgets for men, and cool gifts for dad.
Fixed-bottom versus floating
Keep the two technologies separate in every comparison. NREL’s 2024 ATB treats fixed-bottom offshore wind as the mature configuration in its technology framework. It describes floating offshore wind as nascent and presents gigawatt-scale U.S. cost estimates beginning in 2030. Early demonstration projects can be far more expensive than later commercial arrays because platforms, anchors, port equipment, installation methods and supply chains have not yet reached mature scale.
Capital cost, operating cost and LCOE: use all four lenses
CAPEX shows the initial funding requirement
CAPEX is the amount required to develop and build the plant, but the boundary must be explicit. For solar, ask whether the number includes land preparation, trackers, inverters, collector systems, substation, interconnection, development and contingency. For offshore wind, ask whether it includes foundations or floating platforms, inter-array and export cables, offshore substations, port upgrades, installation vessels, onshore transmission and decommissioning provisions.
Use the same treatment of grid connection. NREL’s $1.56/Wac PV benchmark includes grid connection; an offshore number that stops at the offshore substation is not directly comparable with it.
O&M reveals the cost of keeping the plant productive
Solar operations are largely land-based and can be scheduled around routine electrical and vegetation work, but inverters, trackers, transformers and modules still require inspection and replacement planning. Offshore maintenance must account for marine corrosion, vessel charter rates, weather windows, underwater cables and access restrictions. A lower initial CAPEX can be outweighed by lower or higher lifetime availability depending on the site and equipment strategy.
Capacity factor translates equipment into annual energy
Nameplate megawatts do not equal annual megawatt-hours. Capacity factor reflects the resource and the plant’s availability and losses. Solar output is concentrated in daylight and varies by season and weather. Offshore wind can produce at different hours, but its capacity factor and availability remain site-specific. Compare lifetime production profiles, curtailment and degradation—not just installed capacity.
Rank #4

- Long Nib and Deep Hole Marker: Our mechanical carpenter pencil with 45mm nib is designed for easy marking of deep holes or narrow areas. These construction pencils are the great choice for woodworking tools, construction tools, carpenter tools, contractor tools, wood carpentry tools and architect tools
- Extra Refills in 2 Colors for Versatile Marking: The construction mechanical pencil comes with 12 extra 2.8mm refills, including 6 red and 6 black refills. The black refill is suitable for light surfaces, while the red wax is perfect for dark surfaces. Our carpenter mechanical pencil makes sure that you'll have an ample supply for extended use
- Built-in Sharpener: Our construction pencil comes with a built-in sharpener to ensure the mechanical pencil tip is always sharp and ready for use. Never buy an extra pencil sharpener again. A great tool for any woodworker pencil, contractor pencils. The refill can easily be extended or retracted with a simple click of the pencils mechanical, allowing you to work more efficiently and accurately
- Portable Clip Design: Our deep hole construction pencil features a portable clip design, easy to carry and attach to your pocket or tool box, so that you can keep the carpenter pencils mechanical close at hand, making it a convenient tool to have on the go. Great gifts choice for carpenters
- Stronger Pencil Lead: The black refills are made of lead, sturdy and smooth. The red refills are made of wax, clear and light. These marking pencils are much thicker and stronger than normal pencils during the marking process of construction work, suitable for various surfaces, such as glasses, metal, boards, floors, walls, furniture, etc. The written marks can be easily wiped with a wet paper towel when needed
LCOE is a model output, not a price tag
Levelized cost of energy combines capital spending, operating costs, output and financing over the modeled life. It changes with discount rate, debt structure, tax treatment, capacity factor, construction timing, replacement assumptions and whether transmission or storage is included. A low LCOE in one financial case does not prove that the same technology is cheaper for a project with a different grid boundary, resource or cost of capital.
Project risks by technology
| Risk area | Utility-scale solar | Offshore wind | Owner’s control or response |
|---|---|---|---|
| Design and cost boundary | Tracker choice, DC/AC ratio, module and inverter selection, terrain and interconnection scope can change the estimate. | Turbine rating, foundation or platform, cable route, port plan and vessel assumptions can change the estimate. | Freeze the basis of estimate and publish inclusions, exclusions and escalation rules. |
| Grid connection | Queue timing, network upgrades and the distance to the point of interconnection can affect both cost and schedule. | Export cables, offshore substations, landfall and onshore upgrades add interfaces and permitting dependencies. | Use a milestone-based interconnection plan and carry schedule contingency for network studies and approvals. |
| Procurement | Module, inverter, transformer and tracker availability can alter price and sequencing. | Turbines, foundations, cables, vessels and ports can become critical-path items. | Secure long-lead items only after technical specifications and commercial assumptions are reconciled. |
| Financing | Changes between power-purchase-agreement signing and commissioning can expose the project to price and interest-rate movements. | Commodity inflation, interest rates and vessel scarcity have recently created particularly visible pressure on project economics. | Model escalation and rate sensitivity; include reopener, termination and delay provisions where appropriate. |
| Construction access | Land access, weather and civil works matter, but the reviewed sources do not establish a generic construction duration. | Marine weather windows, specialized vessels, port capacity and seabed conditions can constrain work. | Define weather, marine-access and commissioning assumptions in the baseline schedule. |
| Technology maturity | Utility PV is represented in the ATB by a defined 100-MWdc tracking plant. | Fixed-bottom is modeled as mature; floating commercial-scale U.S. deployment is treated as nascent, with modeled costs from 2030 onward. | Separate proven commercial configurations from first-of-a-kind demonstrations in financing and contingency cases. |
Project timelines: compare milestones, not anecdotes
Use a common milestone dictionary
“How fast is it built?” can refer to several different intervals. For a valid comparison, define at least:
- Development start: the date site control, lease work or formal development begins.
- Permitting submission and approval: jurisdiction-specific environmental, land, marine and construction authorizations.
- Financial close: committed debt and equity under an agreed cost and revenue model.
- Construction start: physical site or marine works, not merely procurement.
- First power: initial electricity delivered to the grid.
- Commercial operation: the contractual date when the facility meets its delivery and acceptance requirements.
Compare the same interval for both technologies, in the same jurisdiction and at a similar project scale. A solar construction date compared with an offshore project’s lease-award date is not an apples-to-apples result.
What the South Fork example demonstrates
The U.S. Department of Energy’s 2024 Offshore Wind Market Report records that the 132-MW South Fork Wind project began delivering power in November 2023 and was fully commissioned on March 14, 2024. Those are documented project milestones, not a typical offshore-wind schedule. The example does not establish a matched utility-PV duration because the available material does not provide a solar project with equivalent start, scope, jurisdiction and milestone definitions.
Quick wins for a faster PC:
Fix the driver behind crashes, sound loss and screen glitchesFind Drivers →Clear out junk files and repair common Windows errorsFree Scan →Scan for outdated or missing drivers - takes under a minuteDriver Scan →Why a universal speed winner cannot be declared
Solar projects are assembled on land from modular equipment, while offshore projects require marine surveys, specialized logistics, export cables and weather-dependent installation. Those structural differences explain why schedules are managed differently, but they do not produce one defensible number for every project. Permitting, interconnection queues, equipment lead times, financing and local construction conditions can dominate either technology’s calendar.
Best Value
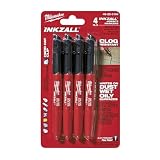
- Milwaukee Ink all Fine Point Marker, Black, 4 Per Pack
- 4 per pack Features Clog Resistant Marker Tip Writes through Dusty, Wet and Oily Surfaces Durable Marker Tip for Writing on Concrete, OSB and Rough Surfaces
- Clog resistant tip writes on dusty, wet and oily surfaces and is optimized for rough surfaces such as OSB, cinderblock and concrete
- Hard hat clip- attaches for easy access
- Quick dry time with reduced smearing and marking
A practical decision process for owners and developers
- Define the service required. State whether the objective is lowest energy cost, a particular annual energy volume, evening or winter production, firm delivery, emissions reduction or a capacity contribution. The answer determines whether an unpaired generation comparison is adequate.
- Set the project boundary. Include or exclude land, ports, substations, export and network upgrades, storage, development costs, taxes and decommissioning consistently. Write the boundary into the basis of estimate.
- Normalize the plant rating. Keep DC and AC ratings distinct for solar. For wind, state turbine rating, number of machines and whether the comparison is fixed-bottom or floating.
- Choose a common dollar year and financial case. Record inflation treatment, discount rate, debt-to-equity ratio, tax assumptions, incentives, construction-period interest and operating life.
- Model the resource and output profile. Use site-specific solar irradiance or wind data, losses, availability, degradation, wake effects, curtailment and hourly production. Compare delivered megawatt-hours and timing, not nameplate megawatts.
- Test interconnection and transmission. Identify the point of interconnection, network upgrades, cable or line route, queue position and expected energization date. A generation cost that omits the required connection is incomplete.
- Build a risk-adjusted schedule. Use the common milestones above, then add procurement lead times, permitting dependencies, weather allowances, commissioning and contingency. Do not substitute the South Fork dates—or any single project—for a portfolio-wide schedule.
- Run sensitivities. At minimum, vary commodity prices, interest rates, capacity factor, equipment cost, vessel availability, interconnection delay and offtake price. For floating wind, add platform and supply-chain maturity cases.
- Make the selection on delivered value. Choose the option that meets the required energy profile and reliability at an acceptable risk-adjusted cost, not the option with the lowest isolated CAPEX or LCOE.
How different project situations change the answer
When a land-based PV case is straightforward
A utility-PV option is easier to underwrite when the site is controlled, civil conditions are known, the interconnection point is nearby, equipment specifications are standardized and the revenue contract matches the expected commissioning date. Even then, the $1.56/Wac NREL benchmark must be adjusted for the actual tracker design, terrain, transmission scope, storage and financing case.
When offshore wind may provide a different system value
An offshore project can offer a production profile that complements daytime solar and can use a coastal transmission point, but that potential value must be tested against marine CAPEX, port and vessel constraints, export-cable scope, financing exposure and site-specific wind production. A favorable resource does not remove construction or contracting risk.
When floating wind needs a separate investment case
Floating wind should be evaluated as an emerging technology pathway rather than blended into a fixed-bottom average. NREL’s decision to begin modeled gigawatt-scale U.S. floating costs in 2030 reflects the maturity assumption in the ATB. Demonstration-scale projects may require larger contingencies, specialized contracting and a financing structure that recognizes first-of-a-kind risk.
Information to require before approving a comparison
- Plant capacity in the correct AC or DC convention and the complete equipment configuration.
- Dollar year, geographic scope, tax and incentive treatment, escalation and financing assumptions.
- CAPEX inclusions and exclusions, especially interconnection, transmission, storage, development and decommissioning.
- Annual and hourly energy production, capacity factor, degradation, availability and curtailment assumptions.
- O&M categories, major-component replacement schedule, access assumptions and insurance.
- Permitting, lease, interconnection, procurement, construction, first-power and commercial-operation dates.
- For offshore wind, water depth, seabed and wave data, port distance, vessel plan, cable route and fixed-bottom or floating configuration.
- Sensitivity cases for interest rates, commodity prices, vessel availability, equipment delays, resource variation and offtake changes.
- A clear statement of what the estimate is: a modeled ATB scenario, a benchmark, a vendor quote, an EPC bid or a project-specific estimate.
Bottom line for a construction decision
Use NREL’s 2024 ATB to establish a common analytical language, not to declare a universal winner. The utility-PV reference of $1.56/Wac in 2023 is useful only with its 100-MWdc, one-axis-tracking design and included grid connection attached to the number. Offshore wind requires a site-specific model because depth, waves, wind, ports, interconnection and vessels materially change the result. Treat fixed-bottom and floating wind separately, and treat the 2030 floating-cost start in the ATB as a maturity assumption rather than a promise about commercial readiness.
For schedules, define identical milestones and compare matched projects. South Fork Wind’s 132 MW, November 2023 first power and March 14, 2024 commissioning are valuable evidence of what one project achieved, not proof that offshore wind—or solar—is always faster. The sound choice comes from a normalized cost model, an hourly output profile and a risk-adjusted schedule built around the actual site and grid connection.
Quick Recap
Product prices and availability are accurate as of the date/time indicated and are subject to change. Any price and availability information displayed on Amazon at the time of purchase will apply.

