Quick wins for a faster PC:
Repair Windows errors before they cause bigger problemsFix Now →Scan for outdated or missing drivers - takes under a minuteDriver Scan →Energy usage effectiveness (EUE) is a proposed building-performance metric that divides a building’s total annual energy use by an adapted calculation of its unregulated process energy use. It is intended to add context that energy use intensity (EUI) can miss, including occupancy, space utilization, plug loads, process loads and the ventilation associated with occupant density. EUE is still a concept under investigation, not a universally adopted standard or a single mandated calculation.
What energy usage effectiveness means
Roger Chang and Drury Crawley define EUE in their 2018 Building Performance Analysis Conference and SimBuild paper as total building energy use divided by an adapted calculation of unregulated process energy use. Chang’s March 2018 summary describes the same idea more briefly as total annual energy use divided by process energy use, with the process component predicted through modeling or measured in operation.
As an Amazon Associate I earn from qualifying purchases.
The distinction between those descriptions matters. An EUE calculation does not automatically mean “total meter energy divided by one directly metered process-load value.” The denominator may be an adapted, modeled value designed to make process energy comparable across buildings or operating conditions. Any published EUE therefore needs to state exactly how its process-energy denominator was produced.
In simplified form:
EUE = total annual building energy use ÷ adapted unregulated process-energy use
#1 Best Overall
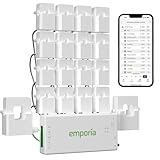
- SAFETY YOU CAN TRUST WITH UL CERTIFICATION: With Emporia Energy, your home energy monitoring is safe, reliable, and certified. The Emporia Vue is UL Listed, meaning it has met rigorous safety standards for electrical products in the U.S. and Canada. This certification ensures that every component has been thoroughly tested to prevent hazards, such as overheating, short-circuiting, or fire, offering you peace of mind as you manage your home’s energy consumption.
- INSTALLS IN CIRCUIT PANEL of most homes with clamp-on sensors. Supports Single phase, Single-split phase, and 2-wire systems. 3-wire systems; 3-phase, 4-wire Wye systems with earthed (TN or TT) neutral (no-Delta) are supported with an additional 200A sensor (sold separately).
- 24/7 ENERGY MANAGEMENT AND MONITORING: Automate, manage and control your home's real power anywhere, anytime to prevent costly repairs, conserve energy, and save costs. Monitor solar / net metering. PROTECTED BY A 1-YEAR WARRANTY.
- LOWER YOUR ELECTRIC BILL: Configure settings in the Emporia Energy App to automate energy management for time of use, peak demand, excess solar, and rewards programs. You can even see live reporting and invaluable savings opportunities instantly. Gauge real-time spending and get actionable notifications and automated energy management to help you reduce costs.
- REAL-TIME ENERGY DATA: REQUIRES 2.4 GHz WIFI WITH AN INTERNET CONNECTION to monitor energy use with iPhone / Android / Web app. Vue sensors collect energy data and are accurate from ±2%. The Vue is UL and CE Listed for your safety. 1 second data is only available in the app (when actively open) and retained 3 hours. Minute and hour data are retained in the cloud. 1 minute data is retained 7 days, 1 hour data is retained indefinitely. Export cloud data whenever you want in the app.
If both terms are expressed in the same energy units and cover the same reporting period, the result is a ratio. The ratio has meaning only when the analyst also reports the building type, climate zone, occupancy assumptions, process-load boundary, normalization method and whether inputs were modeled or measured.
The proposal borrows the word “effectiveness” from the data-center Power Usage Effectiveness discussion, but it is not the same metric and should not be substituted for data-center guidance. Building EUE is aimed at broader building benchmarking and design decisions, where process loads and occupancy patterns vary substantially among offices, schools, healthcare facilities, retail spaces and other uses.
Why EUI alone can be an incomplete signal
EUI is commonly calculated as annual building energy use divided by floor area, often reported in kWh per square metre or kBtu per square foot. It remains useful for tracking a building against its own history or comparing broadly similar buildings. Chang and Crawley’s point is narrower: area-normalized energy does not describe every condition that determines whether a building is delivering useful service efficiently.
Utilization and partial occupancy
A building that is only lightly occupied can show a low EUI because fewer spaces, systems and schedules are being used. That low number may not represent good performance at the occupancy level the building was designed to support. Conversely, a building operating at high utilization can consume more energy while providing more usable space and service.
Occupant density and ventilation
More occupants generally bring higher ventilation requirements and greater internal gains. A densely occupied building may therefore use more total energy while using less energy per person or delivering more activity per square metre. The EUI value by itself does not reveal whether the occupancy assumptions behind two buildings are comparable.
Rank #2
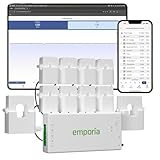
- SAFETY YOU CAN TRUST WITH UL CERTIFICATION: With Emporia Energy, your home energy monitoring is safe, reliable, and certified. The Emporia Vue is UL Listed, meaning it has met rigorous safety standards for electrical products in the U.S. and Canada. This certification ensures that every component has been thoroughly tested to prevent hazards, such as overheating, short-circuiting, or fire, offering you peace of mind as you manage your home’s energy consumption.
- INSTALLS IN CIRCUIT PANEL of most homes with clamp-on sensors. Supports Single phase, Single-split phase, and 2-wire systems. 3-wire systems; 3-phase, 4-wire Wye systems with earthed (TN or TT) neutral (no-Delta) are supported with an additional 200A sensor (sold separately).
- 24/7 ENERGY MANAGEMENT AND MONITORING: Automate, manage and control your home's real power anywhere, anytime to prevent costly repairs, conserve energy, and save costs. Monitor solar / net metering. PROTECTED BY A 1-YEAR WARRANTY.
- LOWER YOUR ELECTRIC BILL: Configure settings in the Emporia Energy App to automate energy management for time of use, peak demand, excess solar, and rewards programs. You can even see live reporting and invaluable savings opportunities instantly. Gauge real-time spending and get actionable notifications and automated energy management to help you reduce costs.
- REAL-TIME ENERGY DATA: REQUIRES 2.4 GHz WIFI WITH AN INTERNET CONNECTION to monitor energy use with iPhone / Android / Web app. Vue sensors collect energy data and are accurate from ±2%. The Vue is UL and CE Listed for your safety. 1 second data is only available in the app (when actively open) and retained 3 hours. Minute and hour data are retained in the cloud. 1 minute data is retained 7 days, 1 hour data is retained indefinitely. Export cloud data whenever you want in the app.
Plug and process loads
Computers, laboratory equipment, kitchen appliances, medical devices, manufacturing equipment and other process loads can dominate energy use in some building types. EUI records the resulting total, but it does not identify whether a high value reflects inefficient building systems or an energy-intensive activity that the building is hosting. The 2018 paper specifically identifies plug loads and process loads as factors not captured by EUI alone.
Thermal comfort and space quality
Energy can be reduced by conditioning less space, accepting uncomfortable temperatures or operating with schedules that do not meet occupants’ needs. A low EUI is not evidence that thermal comfort, indoor environmental quality or functional requirements are being met. EUE also does not measure comfort directly; it is a benchmarking ratio, not an indoor-environment score.
EUI and EUE answer different questions
| Aspect | EUI | Proposed EUE |
|---|---|---|
| Basic calculation | Total annual energy divided by floor area | Total annual energy divided by an adapted unregulated process-energy calculation |
| Primary reference | Building size | Building process-energy activity or service context |
| What it can expose | Area-normalized energy trends and broad peer differences | How much total energy is associated with the modeled or measured process-energy baseline |
| Occupancy treatment | Often implicit or handled separately | Can be represented through occupancy density, process assumptions and related ventilation rates |
| Inputs | Usually utility energy and floor area | Utility energy plus a defined process-energy model or measurement boundary |
| Comparability risk | High when building uses, schedules or occupancy differ | High when denominator definitions, normalization or process boundaries differ |
| Current status | Widely used benchmarking convention | Concept explored in the 2018 paper; no universal implementation protocol is established by the material available here |
Neither metric replaces the other. EUI is usually easier to calculate and communicate. EUE may add explanatory power when the service delivered by a building depends strongly on occupancy or process activity, but it requires more assumptions and documentation.
How to calculate EUE without hiding the denominator
The following workflow follows the logic described by Chang and Crawley while making the reporting choices explicit.
- Set the boundary. Define whether total energy includes electricity, purchased fuels, district energy and on-site generation, and specify the reporting period. Keep the boundary consistent with the process-energy calculation.
- Assemble total annual energy use. Use utility bills, interval meters or a calibrated building model. State whether the figure is measured, simulated or a combination. If on-site generation is involved, explain whether the numerator is delivered energy, site energy or another convention.
- Identify unregulated process energy. List loads driven by the building’s activity rather than by the base building’s regulated systems. Depending on use, this can include equipment, appliances, laboratory systems, data-processing equipment, medical equipment or production machinery. Do not assume every plug load belongs in the same category without documenting the rule.
- Choose the adapted denominator method. The denominator can be estimated from a model, derived from measured operation or assembled from both. Record schedules, equipment power, diversity factors and operating hours. An adapted calculation should be reproducible; a single unexplained meter channel is not enough for cross-building comparison.
- Decide whether to normalize process loads. The conference paper examines normalized and non-normalized approaches. Normalization might hold an activity level, occupant density or process intensity to a common reference; non-normalized values preserve the building’s observed condition. The choice changes the question the ratio answers, so report it beside the result.
- Align occupancy and ventilation assumptions. Occupant density affects both internal gains and outdoor-air requirements. Use the same occupancy basis in the process calculation and in the total-energy model, and document any ventilation-rate assumptions.
- Compute and label the ratio. Divide the total annual energy by the adapted process-energy value, then publish the numerator, denominator, units, period and method—not just the final ratio.
- Interpret against an appropriate comparison group. Compare buildings with similar uses, climate conditions, occupancy and process intensity. A ratio from a laboratory should not be treated as a direct target for a lightly occupied office merely because both have the same floor area.
Illustrative calculation
Consider a hypothetical 100,000-square-metre office whose measured annual energy use is 10,000,000 kWh. Its EUI is 100 kWh/m²-year. Suppose an adapted process-energy calculation estimates 4,000,000 kWh for office equipment and other defined unregulated loads. The resulting EUE is 2.5.
Rank #3

- ⚡ EASY INSTALLATION: Installs in circuit panel of most homes with clamp-on sensors. Supports single-phase up to 240VAC line-neutral; single, split-phase 120/240VAC; and three-phase up to 415Y/240VAC (no Delta). The branch lines can automatically match different phases and have no restrictions in terms of quantity and voltage.Panels with access only to busbars will need flexible sensors available from SEM-Meter.
- ⚡ ENERGY MONITORING ANYTIME, ANYWHERE: Monitor your home's real power anywhere, anytime to prevent costly repairs, conserve energy, and save costs. Monitor solar / net metering. Light commercial 3 phase option available as a separate bundle. Protected by a 1-year warranty.
- ⚡ VARIOUS ELECTRICAL APPLIANCE MONITORING: Comes with 16 50A sensors to accurately monitor your air conditioner, furnace, water heater, washer, dryer, range, etc.
- ⚡ LOWER YOUR ELECTRIC BILL: SEM-Meter measures real-time spending and gets actionable notifications to understand where savings can be made, both to lower your electric bill and to conserve energy and protect the planet’s resources. Be an environmentalist.
- ⚡ REAL-TIME ENERGY DATA: Connect SEM-Meter device via 2.4GHz WiFi to monitor energy usage, with an accuracy range of 1%. View usage in real time through Android/Apple software. Statistics of power usage in now/day/week/month/year format: the validity period of hourly exported data is 90 days, and the exported data of day/month/year data is permanent, available at any time Export from application.
If the analyst instead applies a documented occupancy-normalization method that produces a 5,000,000 kWh process-energy denominator, the EUE becomes 2.0 while the measured total energy and EUI remain unchanged. Neither ratio is automatically “correct” without knowing which operating question the denominator is intended to answer. This example is instructional, not a benchmark value from the 2018 paper.
What the 2018 study examined
Chang and Crawley evaluated benchmark EUE values using all 16 U.S. Department of Energy Commercial Prototype Buildings associated with ASHRAE Standard 90.1-2013. The evaluation covered ASHRAE climate zones and used a bottom-up approach rather than relying only on aggregate utility statistics.
The authors compared EUE with calculated EUI and investigated several choices that can materially change a result:
- normalized versus non-normalized treatment of unregulated process loads;
- occupant-density assumptions;
- ventilation rates associated with those occupancy assumptions;
- building type and climate zone; and
- the relationship between modeled process activity and whole-building energy.
The 16 prototypes are a defined analytical sample, not a measured performance claim about all commercial buildings. Their value is in showing why a denominator and its assumptions must travel with an EUE result.
Potential use in building design
Testing design options
During concept and detailed design, teams could calculate EUI and EUE for the same option set. A façade change, HVAC strategy or control sequence may lower regulated energy while leaving process energy unchanged. Another design may support higher occupant density or more equipment with a modest increase in total energy. Looking at both ratios helps the team ask whether a change improves the building system or simply shifts the activity assumptions.
Outdated Drivers Are Slowing You Down
One free scan finds every outdated or missing driver and matches the right update for your exact hardware.Free scan · exact hardware matchWindows Errors? Fix Them Before They Spread
Repair common Windows errors and clear accumulated junk for a smoother, more stable PC - no reinstall needed.Free scan · no reinstallRank #4

- AUDIT EVERY CENT & SLASH ELECTRIC BILLS: Stop the guesswork and start saving. By monitoring 18 individual circuits with professional ±1% precision, Refoss Home Energy Monitor shows exactly where your money goes. Identifying “energy vampires”—from HVACs to aging appliances—in real-time helps households effectively reduce monthly utility bills by 10%-20%. This smart power meter is the ultimate tool for electricity consumption audits.
- LOCAL PRIVACY & MULTI-PLATFORM CONTROL: Your home energy data belongs to you, not a cloud server. Featuring a built-in Local Web UI, Open API, and MQTT, and WebSocket, Refoss ensures 100% data privacy. Seamlessly integrate with Home Assistant (via Refoss_RPC) to manage every kWh without cloud reliance or subscription fees. Ideal for a secure electricity monitor with professional local control.
- SMART AUTOMATION & SOLAR ROI OPTIMIZATION: Turn your solar panels into a high-yield investment. Surplus solar and net metering energy can be directed to medium-power appliances like heat pumps, dishwashers, and microwaves, while time-of-use and peak demand energy management ensures maximum solar self-consumption, prevents low-value grid feed-in, and reduces utility bills.
- 5-YEAR DATA ANALYTICS & SMART FAULT ALERTS: Catch appliance failures early before they become expensive repairs. Refoss records minute/hourly/daily/weekly/monthly/yearly usage, with daily data securely stored for 5 years and fully exportable via CSV without any subscription. Receive smart alerts if a fridge or washer consumes unusually high energy, helping you optimize home power usage habits and prevent bill spikes.
- STABLE SIGNAL & EASY SETUP: This system supports Single-phase, Split-phase, and 3-phase 4-wire Wye systems, featuring 2 main sensors (up to 200A) and 16 branch sensors (up to 60A). ETL certified with a 2-year warranty, it includes an external high-gain antenna for enhanced Wi-Fi stability. Most importantly: if a sensor is installed backward, simply flip the reading in the App with one tap—no need to rewire or reopen the live breaker box.
Making scenarios explicit
Designers should model at least the occupancy and process scenarios that drive the brief: expected average occupancy, peak occupancy, equipment schedules and any high-load spaces. Reporting a single EUE based on one schedule can create false precision. A scenario table that shows the denominator and ratio for each case is more transparent than one “design EUE” with no operating context.
Supporting early decisions
EUE is most useful early when it exposes a mismatch between the intended service and the energy model. If a project’s process loads are unknown, the right response is to improve the brief or use a clearly labeled proxy—not to present a highly precise ratio. The metric should inform design optimization, not replace load calculations, comfort analysis or code compliance checks.
Potential use in operations and commissioning
The paper discusses tracking real-time EUE as a possible way to optimize part-load system performance. In an operating building, interval energy data could be paired with occupancy and process-activity data to show when whole-building energy is diverging from the activity being served. That could help a commissioning team investigate schedules, simultaneous heating and cooling, controls, or equipment that remains on when process demand is low.
This is a potential application, not an established operational standard. Reliable use would require functioning meters, a stable process-energy definition, time-synchronized occupancy or activity data and a method for handling missing or anomalous readings. A sudden ratio change may indicate a controls problem, a change in occupancy, a new piece of equipment or a denominator-data error; it is not a diagnosis by itself.
The Tool Desk
Outbyte Driver Updater FREEFix the driver behind crashes, sound loss and screen glitchesFind Drivers →Outbyte PC Repair FREERepair Windows errors before they cause bigger problemsFix Now →Potential use in portfolios and outcome-based codes
For portfolio analysis, EUE could provide another way to group buildings by the service they deliver rather than by floor area alone. A portfolio owner might examine offices, hospitals and laboratories separately, then compare normalized and non-normalized results within each group. Such analysis could reveal where a high EUI is largely explained by process intensity and where base-building systems appear inefficient relative to the same activity level.
Best Value

- EM16P MODEL & LOCAL CONTROL & DATA PRIVACY: Access your home energy monitor data locally via Built-in Web UI, Open API, and MQTT without relying on cloud services. Unlike cloud-dependent monitors, Refoss ensures your data stays within your home network. Direct local access protects your privacy while giving you 100% full control of your home energy system.
- NATIVE HOME ASSISTANT & OPENCLAW AI: Experience seamless Native Home Assistant integration right out of the box—no firmware flashing or complex coding required. Featuring ✨NEW✨ OpenClaw Support, it enables AI-driven automation for smarter, real-time energy management and seamless smart home control.
- MAXIMIZE SOLAR & ZERO FEED-IN AUTOMATION: Designed for solar homes, the power monitor works with the Refoss app and Home Assistant to automatically use surplus solar power. Appliances like EV chargers, washing machines, and water heaters are powered during midday peaks, maximizing solar self-consumption and reducing low-value electricity feed-in to the grid. Optimizes usage and reduces bills.
- REAL-TIME MONITORING & ±1% ACCURACY: Monitor voltage, current, active power, and power factor of major appliances. Provides ±1% accuracy (200A: 2–200A; 60A: 1–60A) and ±2% at low current. Daily data stored up to 5 years and exportable. With no subscriptions or hidden fees, you get deep historical insights to help you identify every energy-saving opportunity and save 10–20% on monthly bills.
- SMART ALERTS & CIRCUIT-LEVEL CONTROL: Set usage targets for each individual circuit and receive instant alerts when appliances exceed normal consumption. Refoss app supports automation and peak management to optimize schedules, reduce peaks, and improve efficiency. Real-time electricity usage monitor for circuit-level insights.
The conference paper also discusses possible relevance to outcome-based code frameworks. In that setting, an EUE-like measure could help connect measured operational energy with the activity a building supports. Any code use would require an adopted definition, verification rules, treatment of changing occupancy and enforcement procedures. The paper does not establish those rules or demonstrate broad regulatory deployment.
Common interpretation errors
Treating every denominator as equivalent
A directly metered process load, a modeled equipment schedule and an occupancy-normalized estimate are not interchangeable. Put the denominator method in the result name or reporting note.
Comparing unlike buildings
Climate, building type, operating hours, occupant density and process equipment can all change the ratio. Cross-building rankings without those qualifiers can reward a favorable assumption rather than better performance.
What’s actually slowing this PC down?
Pick the symptom - the matching free tool is one click away.
Using EUE to claim comfort
Neither a low EUI nor a favorable EUE proves that temperatures, humidity, air quality, lighting or acoustics meet the project’s requirements. Pair energy metrics with indoor-environment measurements and occupant outcomes.
Ignoring process-load changes
A tenant fit-out, new server room, expanded kitchen or laboratory installation can alter the denominator and numerator. Recalculate or restate the baseline when the building’s activity changes.
Assuming a universal target
The available paper explores benchmark values but does not provide a universally valid pass/fail threshold. A target must be tied to a building type, climate, occupancy scenario, process definition and purpose.
Implementation checklist for project teams
- Write the energy boundary and reporting period before collecting data.
- Separate regulated building-system energy from defined unregulated process energy in the model or meter map.
- Document equipment schedules, diversity assumptions, occupant density and ventilation rates.
- State whether each input is measured, modeled or normalized.
- Publish the numerator, denominator and resulting EUE together.
- Report EUI beside EUE rather than substituting one for the other.
- Use a comparison set matched for building use and climate zone.
- Revisit the baseline after major occupancy, equipment or operating-schedule changes.
- Use EUE as evidence for investigation, not as a stand-alone comfort, code or commissioning verdict.
What readers should call EUE today
The most accurate description is “a proposed building benchmarking metric.” The 2018 conference paper provides a technical definition and explores how EUE might support design optimization and portfolio analysis. It also considers operations and outcome-based codes as possible applications. The material available does not establish broad adoption, a governing standard, or one universal calculation protocol.
For a project team, the practical lesson is straightforward: retain EUI for area-normalized reporting, then add EUE when the building’s energy story depends on occupancy and process activity. The credibility of the result rests less on the ratio’s decimal precision than on a transparent, reproducible denominator and clearly stated operating context.
Quick Recap
Product prices and availability are accurate as of the date/time indicated and are subject to change. Any price and availability information displayed on Amazon at the time of purchase will apply.

