Recommended Free Tools
Data literacy is the ability to collect, manipulate, interpret and communicate information well enough to support a project or business decision. For architecture, engineering and construction (AEC) firms, that capability belongs to people and operating practices—not just to a database, dashboard or enterprise system. A team with modest spreadsheets but strong analytical judgment can make better use of evidence than a team with sophisticated infrastructure that cannot recognize a misleading chart, a missing field or an unsupported conclusion.
Nathan Miller made that case in Building Design + Construction on May 24, 2017: changing people is harder than purchasing new tools. The practical response is to build data capability deliberately through knowledge sharing, explicit hiring expectations, clear project priorities and tools selected to support those capabilities.
As an Amazon Associate I earn from qualifying purchases.
What data literacy means on an AEC project
Data literacy is often reduced to “having the data” or opening a dashboard. That is too narrow. A data-literate person can ask whether the information is fit for the decision, prepare it without quietly changing its meaning, interpret patterns and uncertainty, and explain the result to someone who must act on it.
Outdated Drivers Are Slowing You Down
One free scan finds every outdated or missing driver and matches the right update for your exact hardware.Free scan · exact hardware matchWindows Errors? Fix Them Before They Spread
Repair common Windows errors and clear accumulated junk for a smoother, more stable PC - no reinstall needed.Free scan · no reinstallIn an AEC organization, the information may sit in enterprise systems, databases, dashboards or spreadsheets. The storage method is secondary. The essential question is whether the team can move from evidence to a defensible conclusion.
#1 Best Overall

- Valued Carpenter Pencil Set: You will get 2 pcs solid carpenter pencils with 26 piece 2.8 mm refills, 1 replaceable sharpener, 1 plastic storage box.The complete carpenter pencils combination allows you to finish your work faster and more easily
- Deep Hole Marker Pencil: The deep-hole construction pencils adopts 45mm elongated tip design, which is more convenient to mark in the small hole or in other tight areas that other carpenter markers cannot reach
- Carpenter Pencils with Sharpener: The sharpener is screwed into the top of the work pencil, which won't get lost either. Built-in pencil sharpener that keep the lead with pointed and smooth to Improves line of sight in fine work
- Stronger Solid Lead: This work pencil is matched with a 2.8 mm thick lead , which is much thicker and stronger during the drawing process of construction work, it will not break or damage easily
- Marks on Various Surfaces: 3 colors solid construction pencil can marks on various surfaces,such as metal, plastic, wood, paper etc. Ideals for woodworkers, contractors, craftsmen, builders, merchants and masons
| Capability | What it looks like in practice | Questions a team should ask |
|---|---|---|
| Collect | Identify the fields, sources and timing needed for a decision, then capture them consistently. | Who created this record? When was it created? What is missing? |
| Manipulate | Clean, combine, filter and transform information without hiding assumptions or changing definitions. | Did a formula, filter or unit conversion alter the result? |
| Interpret | Use statistical reasoning and meaningful visualizations to distinguish a useful pattern from noise or a misleading presentation. | What conclusion is justified, and what conclusion is not? |
| Communicate | Present the evidence, limitations and recommended action in language the intended decision-maker can use. | Can another person reproduce the reasoning and understand the caveats? |
Statistical analysis and meaningful data visualization are therefore practical data-literacy skills, not specialist decorations. A project manager does not need to become a statistician, but must know enough to challenge an implausible comparison, ask how a sample was formed and avoid treating correlation as proof of cause.
Why better infrastructure does not automatically produce better decisions
Buying a new system can make information easier to store or display, but it cannot supply judgment. A dashboard may show a late activity; it cannot determine whether the date is current, whether the activity definition changed, or what intervention is appropriate. A database may contain thousands of records; it cannot tell a team that a key category was never captured.
Miller’s comparison is deliberately simple: sophisticated infrastructure with staff who cannot interpret it may be less useful than ordinary spreadsheets operated by people who understand analysis and the limits of their data. This is not an argument against modern systems. It is an argument for treating the human capability to use them as part of the investment.
Quick wins for a faster PC:
Fix the driver behind crashes, sound loss and screen glitchesFind Drivers →Clear out junk files and repair common Windows errorsFree Scan →Use these checks before assuming a technology purchase will solve a decision problem:
- Can the people closest to the work explain what each important field means?
- Can they identify missing, duplicated, stale or contradictory records?
- Can they manipulate the information and preserve an audit trail of what changed?
- Can they draw a conclusion that is proportionate to the evidence?
- Can they explain uncertainty and limitations to a client, leader or trade partner?
Four organizational levers for building capability
The source article points to four mutually reinforcing levers. They are organizational choices rather than a prescribed software stack.
1. Make knowledge sharing continuous
One-off training disappears when the project schedule tightens or when a new employee joins after the session. Set up recurring opportunities for people to demonstrate how they collect, clean, interpret and present information. A short workshop can use a real project question, show the underlying records, and make the assumptions visible.
Rank #2

- Ergonomically Designed: Work in tight areas with a compact design that gets into tough spots
- Both tools are designed to fit into difficult to reach spaces
- Complete a wide range of applications with a high-performance motor that delivers up to 300 UWO, and an impact driver delivering up to 1,400 in-lbs of torque
- Both the DEWALT impact driver and drill driver feature integrated LED work lights with a convenient 20-second delay, ensuring enhanced visibility in dimly lit or challenging work areas
- One-Handed Loading - Keep one hand free with a 1/4 in. hex chuck that accepts 1 in. bit tips
Record workshops so staff who miss the live session can learn later. Store the recording with the example file, definitions and a brief explanation of known limitations. A recording without context becomes difficult to reuse; pair it with a simple index such as “where the source data comes from,” “which transformations were applied” and “what decision the analysis supports.”
Encourage two-way teaching. Field staff can explain how a record is generated, while analysts can explain how that record is transformed. This exposes gaps between how a process is intended to work and how information is actually created.
2. Put data expectations in hiring and assessment
Job descriptions should say what data work the role requires instead of assuming that every candidate interprets “computer skills” the same way. Depending on the position, expectations might include handling tabular information, creating a clear visualization, documenting assumptions or explaining a conclusion to a non-specialist.
Assessment should test reasoning, not only tool familiarity. Ask candidates to review a small, clearly described example and identify what they would verify before relying on it. A candidate who can name a limitation and propose a sensible check may be more valuable than one who can produce a polished chart without questioning its inputs.
Request relevant examples of data handling, visualization or tool use when those examples are genuinely related to the role. Be explicit about the level required: a site-oriented role may need to interpret a trend and report a discrepancy, while an analyst may need to build repeatable transformations and explain statistical choices.
The Tool Desk
Outbyte Driver Updater FREEScan for outdated or missing drivers - takes under a minuteDriver Scan →Outbyte PC Repair FREEClear out junk files and repair common Windows errorsFree Scan →3. Let business and project priorities determine the “why”
Data capability grows faster when people know which decisions matter. A company or project priority provides that direction. Without it, teams can spend time producing attractive reports that no one uses or collecting fields that do not change an action.
Rank #3

- 【Great Compatibility】This Katerk 1/4 inch hex shank bit holder is specifically designed for 1/4 inch hex shank drill bits. It's compatible with most 1/4 fast hex handles, hex sockets, various electric screwdrivers, and handheld screwdrivers. The bit holder makes it a valuable addition for any handyman.
- 【Secure and Safe】Built with a secure backup nut design, each drill bit holder securely locks onto your bits, ensuring they stay firmly in place. Additionally, our bit holder incorporates a high-quality steel ball rolling design that holds up to several kilograms of weight, ensuring your various drill bits don't fall off.
- 【Easy One-Handed Operation】The bit holder for impact driver allows you to change bits single-handedly, simplifying your workflow. Its multi-color design further allows for quick identification of the drill bit you need.
- 【Compact and Convenient】Thanks to its compact size, this 1/4 inch bit holder is easy to carry around. The bit holder allows for easy attachment to various tools, making this a convenient addition to your construction accessories. The Katerk bit holder is cast from high-quality alloy material, promising a long product lifespan. Despite its rugged strength, the bit holder remains lightweight, making it portable.
- 【Cool Christmas Gift For Men Stocking Stuffers】 This screwdriver bit holder, driver bit holder, impact bit holder, can be given as a gift to your loved one, especially for anyone involved in construction or electrical work. It's a must-have for stocking stuffers for men and women, tools gifts for dad, tech gadgets for men, gifts for dad, gifts for him, gifts for husband, gifts for boyfriend, cool gadgets for men, and cool gifts for dad.
Write the decision in plain language before choosing a measure. For example: “Which constraint should the team address this week?” is a decision question; “Create a dashboard” is not. Define the audience, the decision date, the acceptable level of uncertainty and the action that follows a finding.
Priorities also prevent false precision. If the business needs an early warning, a timely indicator with known limitations may be more useful than a perfectly reconciled report that arrives after the decision window. Document the trade-off so later users do not mistake an early signal for a final account.
4. Select tools to support the capability
Tools should fit the skills, workflows and priorities already identified. Compare options by asking whether staff can access the needed information, apply transparent transformations, preserve definitions and communicate results to the intended audience. A familiar spreadsheet can be appropriate for a bounded question when its assumptions and version are controlled. A larger system may be justified when the team needs shared records, repeatable processes or broader access.
The article does not establish a current product ranking, implementation sequence or measured return for any tool. Treat technology selection as a means to support data-literate behavior, not as evidence that the behavior exists.
A practical way to start without waiting for a new system
The following sequence is an implementation aid, not a validated industry standard. Adapt it to the size and maturity of the organization.
- Choose one decision. Select a recurring project or business decision where people already spend time reconciling information or debating its meaning.
- Map the evidence. List the source records, owners, definitions, update timing, transformations and known gaps. Include informal spreadsheets if they influence the decision.
- Test interpretation. Ask several roles to review the same evidence independently. Compare the conclusions and the questions they raise; disagreement often reveals an unclear definition or an unrecorded assumption.
- Define the communication. Decide what the audience needs to see, which caveats belong beside the finding and what action will follow.
- Share the method. Hold a short workshop using the real example, record it, and save the definitions and limitations with the working file.
- Update role expectations. Add the demonstrated skills to relevant job descriptions, onboarding and performance conversations.
- Revisit the priority. After the decision cycle, check whether the information changed an action or merely generated another report. Keep, change or retire the process accordingly.
How to judge the quality of an analysis
Check the question before the chart
A visualization is meaningful only in relation to a decision. State the question, the population being considered and the time period. A line that rises may reflect a change in reporting practice rather than a change in project conditions. A percentage can be misleading when the underlying count is small or when the denominator changes.
Rank #4

- Long Nib and Deep Hole Marker: Our mechanical carpenter pencil with 45mm nib is designed for easy marking of deep holes or narrow areas. These construction pencils are the great choice for woodworking tools, construction tools, carpenter tools, contractor tools, wood carpentry tools and architect tools
- Extra Refills in 2 Colors for Versatile Marking: The construction mechanical pencil comes with 12 extra 2.8mm refills, including 6 red and 6 black refills. The black refill is suitable for light surfaces, while the red wax is perfect for dark surfaces. Our carpenter mechanical pencil makes sure that you'll have an ample supply for extended use
- Built-in Sharpener: Our construction pencil comes with a built-in sharpener to ensure the mechanical pencil tip is always sharp and ready for use. Never buy an extra pencil sharpener again. A great tool for any woodworker pencil, contractor pencils. The refill can easily be extended or retracted with a simple click of the pencils mechanical, allowing you to work more efficiently and accurately
- Portable Clip Design: Our deep hole construction pencil features a portable clip design, easy to carry and attach to your pocket or tool box, so that you can keep the carpenter pencils mechanical close at hand, making it a convenient tool to have on the go. Great gifts choice for carpenters
- Stronger Pencil Lead: The black refills are made of lead, sturdy and smooth. The red refills are made of wax, clear and light. These marking pencils are much thicker and stronger than normal pencils during the marking process of construction work, suitable for various surfaces, such as glasses, metal, boards, floors, walls, furniture, etc. The written marks can be easily wiped with a wet paper towel when needed
Make transformations visible
Record filters, exclusions, unit conversions, grouping rules and calculated fields. Keep the original data available when possible. If a spreadsheet is the working tool, label the input, calculation and output areas so another person can follow the chain.
Look actively for missing and misleading data
Ask which records never enter the system, which teams use different definitions and which dates are updated manually. Compare the apparent result with what people know from the work. A discrepancy is not automatically proof that the data is wrong; it is a prompt to investigate how the records were produced.
Separate evidence from interpretation
Write down the observed pattern first, then the conclusion and then the recommended action. This structure makes it easier to challenge an assumption without dismissing the underlying record. It also prevents a confident narrative from being mistaken for a measured fact.
Independent reader supportYour contribution helps us test, update, and keep practical guides available for everyone.Illustrative uses across the project lifecycle
These examples show how the four capabilities can be applied; they are not claims of measured performance.
Preconstruction
A team comparing previous estimates can document which records are complete, normalize units and identify conditions that make projects non-comparable. The useful output is not simply a ranked list; it is a conclusion that states what the evidence supports and where the comparison breaks down.
Design and coordination
When teams track open items, data literacy means agreeing on what “open,” “assigned” and “resolved” mean, checking whether status changes are timely, and presenting a view that helps the next coordination decision. A polished visualization cannot compensate for inconsistent status definitions.
Best Value
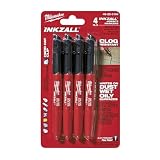
- Milwaukee Ink all Fine Point Marker, Black, 4 Per Pack
- 4 per pack Features Clog Resistant Marker Tip Writes through Dusty, Wet and Oily Surfaces Durable Marker Tip for Writing on Concrete, OSB and Rough Surfaces
- Clog resistant tip writes on dusty, wet and oily surfaces and is optimized for rough surfaces such as OSB, cinderblock and concrete
- Hard hat clip- attaches for easy access
- Quick dry time with reduced smearing and marking
Field operations
Supervisors may need to combine observations from the field with planned information. They should be able to explain the source and age of each record, flag gaps and communicate whether a pattern is strong enough to change the next work plan.
Commercial and business decisions
Leaders reviewing cost, schedule or workload information need the same discipline: know the denominator, understand exclusions, distinguish a forecast from a recorded amount and ask what action the analysis is intended to support.
Common failure modes and practical fixes
| Failure mode | Why it happens | Fix |
|---|---|---|
| Dashboard first, question later | The visible output becomes the objective. | Write the decision and audience before selecting a view. |
| Training is a single event | People miss it or cannot connect it to their work. | Use recurring sessions, real examples and recorded learning resources. |
| Hiring focuses on software names | Tool familiarity is mistaken for analytical judgment. | Assess data handling, interpretation, visualization and the ability to explain limitations. |
| Different teams use different definitions | Records are collected locally without shared vocabulary. | Publish field definitions, owners and update rules alongside the analysis. |
| Missing data is hidden | Pressure for a clean answer discourages caveats. | Show what is absent, how it may affect the conclusion and what would improve confidence. |
| Reports have no decision owner | Information is circulated without a next action. | Name the person or group responsible for responding to the finding. |
Questions leaders can use in a capability review
- Do our teams strive to use evidence in support of their solutions?
- Can they draw useful conclusions from the evidence available to them?
- Which decisions repeatedly require manual reconciliation?
- Where do definitions, ownership or update timing differ between teams?
- Which data skills are expected in each role, and how are they assessed?
- How does each major report connect to a stated company or project priority?
- Can a person who missed a workshop learn the method from a recording and its supporting files?
- Which tool limitation is most likely to mislead a decision-maker, and who is responsible for managing it?
What this approach can—and cannot—promise
Building data literacy can make the organization better prepared to question evidence, interpret information and communicate decisions. It does not guarantee a particular productivity gain, project result or financial return. The May 2017 article supplies an argument and practical directions, not benchmark statistics, a tested implementation sequence or a current comparison of products and services. Organizations should therefore evaluate their own decisions, learning uptake and data quality rather than claim an outcome that has not been measured.
What’s actually slowing this PC down?
Pick the symptom - the matching free tool is one click away.
The central management choice is to treat capability as part of the data strategy. Infrastructure matters, but people must still collect information carefully, manipulate it transparently, recognize gaps, interpret it responsibly and communicate what action the evidence supports.
Frequently Asked Questions
Is data literacy the same as knowing how to use a dashboard?
No. A dashboard is an access and presentation method. Data literacy also requires checking definitions and gaps, manipulating information correctly, interpreting patterns and communicating a conclusion that fits the evidence.
Do AEC employees need advanced statistics?
Not every role needs advanced statistics. Every role that uses evidence does need enough statistical and visualization understanding to question comparisons, recognize misleading presentations and avoid conclusions that the data cannot support.
Should a construction company replace spreadsheets to become data-literate?
Not automatically. A controlled spreadsheet can support a bounded decision when its inputs, transformations, definitions and version are clear. Select a larger system when the priority requires shared records, repeatability or broader access; the tool does not replace judgment.
Free tools Windows power users keep installed
One-click scans. No signup required.
How can a small firm begin?
Choose one recurring decision, map its evidence and gaps, test how different roles interpret it, run a short recorded workshop, and document the definitions and limitations. Then make the demonstrated skills explicit in relevant hiring and onboarding expectations.
What did the 2017 Building Design + Construction article measure?
It did not provide named statistics, benchmark figures or measured outcomes. It presents an organizational argument and recommendations centered on people, knowledge sharing, priorities and supporting tools.
Quick Recap
Product prices and availability are accurate as of the date/time indicated and are subject to change. Any price and availability information displayed on Amazon at the time of purchase will apply.

