Yes—but only within limits. A 2015 analysis of 260 randomly selected intersections in Toronto and Tokyo found that collision rates increased when lanes became wider than roughly 10 to 10.5 feet. The same account also reported higher crash rates below about 10 feet, so it does not support a simple rule that narrower lanes are always safer. The evidence points instead to a context-dependent range, with estimated city-specific minima of 3.1 metres in Tokyo and 3.2 metres in Toronto.
Those figures come from an observational comparison of selected intersections, not a universal engineering specification. Lane width was one part of a street environment that also included speed, intersection geometry, traffic composition and local design practice. The findings are useful for questioning unnecessarily wide urban lanes, but they should not be applied as a single standard to every road.
As an Amazon Associate I earn from qualifying purchases.
What the Toronto–Tokyo analysis found
Building Design + Construction reported on June 5, 2015, that Dewan Masud Karim reviewed existing studies and examined crash databases for intersections in Toronto and Tokyo. The article says the analysis considered 260 randomly selected intersections. Its central result was a curved relationship between lane width and collisions rather than a straight line in which every additional foot made a road safer or more dangerous.
Crash rates rose above roughly 10.5 feet
According to the article, collision rates began rising when lanes exceeded approximately 10.5 feet. It specifically associated lanes measuring 12 feet or more with greater crash rates and higher impact speeds. In practical terms, an urban lane built to a highway-like width may encourage drivers to travel faster than the surrounding intersection environment requires.
#1 Best Overall

- Highly Visible: The bright orange safety color and 360 degree reflective collars make the parallel parking cones visible from a long distance during day or night
- Easy to Store: This set of collapsible traffic cones can be easily folded to a height of 1.7 inches, which is very easy to store, and there is a storage bag inside, so you can stack them when you don't need to use them, which is convenient for you to carry
- Stable: The base of cones is 11.4" X 11.4" and the weight of each road cone is 1.45 lbs, meaning that they'll stay put exactly where they need to be. Whether you're trying to control driveway traffic or keep footfall in order at a festive event
- Widely Use: These road cones can collapse up to 28 inches tall, and each cone with 2 reflective collars means people are unlikely to miss them, suitable for parking lots, driving Training, building construction, warning areas
- Plastic Base: The cone part of our traffic cone is made of Oxford cloth, the base is made of plastic, and the base size is 11.4 inches X 11.4 inches. NOTE: the base is made of plastic, please be careful not to be crushed by cars when using it
Crash rates also rose below roughly 10 feet
The same account reports an increase in crash rates when lanes fell below about 10 feet. That lower bound matters: the result is not an argument for making every lane as narrow as possible. Very narrow lanes can create their own conflicts, especially where vehicles must pass, turn, queue or share space with larger vehicles.
The reported “minimum” differed by city
A 2015 Complete Streets Forum program summarizing Karim’s presentation identified estimated safety minima of 3.1 metres for Tokyo and 3.2 metres for Toronto. Those values are close, but they are not identical. They should be read as estimates from the two city datasets, not as a globally valid target width.
| Measurement | Approximate imperial equivalent | How it appears in the sources |
|---|---|---|
| 3.1 m | 10.2 ft | Estimated Tokyo safety minimum in the 2015 Complete Streets Forum program |
| 3.2 m | 10.5 ft | Estimated Toronto safety minimum in the 2015 Complete Streets Forum program |
| 10 ft | 3.05 m | Lower point at which the Building Design + Construction account says crash rates rose below it |
| 10.5 ft | 3.20 m | Approximate upper point above which the account says rates rose |
| 12 ft or more | 3.66 m or more | Associated in the account with greater crash rates and higher impact speeds |
Small differences between the rounded feet and metre figures are normal conversions. They do not turn the reported values into a formal design code.
Rank #2

- 5.5 lbs Heavy Duty Base: These 28-inch traffic cones meet US MTUCD standards and won't be blown over or moved easily, meaning they stay where you need them
- Flexible PVC: The road parking cones is made of sturdy PVC material, can withstand vehicle impacts, bend under pressure, and rebound to their original shape without cracking
- High Intensity Reflective Strips: Each large traffic cone has 1 4-inch and 1 6-inch reflective collar, ensuring 360° visibility day and night even in low-light or rainy conditions, enhancing the safety of drivers and workers
- Multiple Uses: Can be used for highway maintenance, road works and construction, marking road hazards, parking lots, or crowd control
- Easily Stored for Transport: The traffic cones are easy to stack together and take up very little space in your car or garage, making storage and transportation very easy
Why the headline needs qualification
“Wider lanes make city streets more dangerous” captures one part of the reported pattern, but it leaves out the lower end of the curve and the limits of the comparison. A more accurate reading is that, in the Toronto and Tokyo intersection data described in 2015, both unusually narrow and unusually wide lanes were associated with more collisions than a middle range.
This was an observational analysis
The sources describe a review of existing material and crash databases, not a randomized experiment in which identical intersections were assigned different lane widths. Wider lanes may occur on roads that already have higher traffic volumes, different signal timing, more turning movements, faster posted speeds or other design characteristics. The reported association therefore does not prove that lane width alone caused each crash or speed difference.
The cities are not interchangeable
Tokyo and Toronto differ in street networks, vehicle fleets, driving norms, land use and intersection design. A width that performs acceptably in one setting may have a different effect in another. The city-specific minima in the forum program are a reminder to treat local data and operating conditions as part of the design decision.
Rank #3
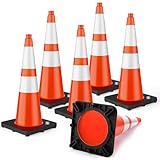
- BLACK WEIGHTED BASE: These safety cones are 28 inches tall and feature a heavy duty black rubber base that ensures they stay upright and are not easily knocked over by people or cars. They also remain stable in high winds, heat, direct sunlight and other inclement weather
- 2 HIGHLY VISIBLE REFLECTIVE COLLARS: The bright orange color and 2 highly refective collars on each cone ensure high visibility during the day and night
- FLEXIBLE PVC:These construcion cones are made of sturdy, stable flexible pvc that can withstand heavy loads without deforming
- EASY STORAGE: Each cone can be stacked for compact storage, taking up minimal space in your car or garage. This makes them easy to carry and storage
- Suitable for Multiple Scenarios:This black base traffic safety cone is designed for versatile use in various settings, including roadway control, parking lots, construction sites, school zones, and event management. It can assist with vehicle guidance, temporary lane marking, hazard warnings, and crowd control, making it a practical option for both indoor and outdoor safety needs
The impact-speed comparison is suggestive, not causal
Building Design + Construction reported that Toronto’s average crash impact speed was 34% higher than Tokyo’s. The article presents that contrast as suggestive; it does not establish that lane width alone produced the difference. Impact speed is also an outcome related to the severity of a collision, so it should not be confused with the number of collisions.
How the evidence differs across studies
It is easy to combine every lane-width finding into one rule, but the cited sources measure different things. The following distinctions prevent an intersection study from being treated as if it were a roadway-segment study.
| Source and year | Geography | Unit of analysis | Reported result | What it cannot establish |
|---|---|---|---|---|
| Karim analysis as reported by Building Design + Construction, 2015 | Toronto and Tokyo | 260 randomly selected intersections | Crash rates rose above about 10.5 ft and below about 10 ft; lanes of 12 ft or more were linked with greater crash rates and higher impact speeds | A universal lane-width threshold or proof that width alone caused crashes |
| Complete Streets Forum program, 2015 | Tokyo and Toronto | Presentation summary of the intersection analysis | Estimated minima of 3.1 m in Tokyo and 3.2 m in Toronto; wider lanes associated with greater crash rates and impact speeds | A verbatim transcript, a new dataset or a single standard for all cities |
| Florida roadway-segment study abstract, 2015 | Florida | Roadway segments rather than intersections | Nonlinear effects of lane width, with the relationship varying by posted speed limit | A replication of the Toronto–Tokyo intersection result |
The Florida finding is important context because it shows why speed-limit conditions and the unit of analysis matter. A roadway segment between intersections operates differently from an intersection approach, and a curve that changes with posted speed cannot be reduced to one width-only rule.
Rank #4

- Nighttime Visibility - These orange cones with high-intensity 360° reflective bands help drivers spot hazards from afar after dark and in daylight, guiding traffic around a work zone or driveway.
- Heavy-Duty Stability - These are weighted 5.3-lb parking cones. Each traffic cone uses a square base for stability on asphalt, concrete, and uneven surfaces - reliable for job sites and lane control.
- Flexible PVC Durability - Withstanding impact, these street cones bend when bumped, then spring back to shape without easily cracking, which means fewer replacements even during repeated deployment.
- Ready for the Sun & Cold Weather - The road cones stay bright and dependable through sun exposure and low temperatures, maintaining performance across seasons for long-term use on campuses or properties.
- Stackable, 28-Inch Tall Cones - The traffic safety cones create clear boundaries fast; they're stackable construction cones that nest together for compact storage - easy to transport and store.
Why lane width might change driver behaviour
The cited sources report associations; they do not test every mechanism behind them. Several plausible explanations can nevertheless guide interpretation and further evaluation.
Perceived space can affect speed
A broad lane gives a driver more lateral room and may make a street feel like a higher-speed facility. At an intersection, that perception can carry into the approach, producing faster entry or harder braking. The reported association between lanes of 12 feet or more and higher impact speeds is consistent with that possibility, but it does not prove the mechanism in any individual crash.
Recommended Free Tools
Crossing distance grows with width
For someone walking across a road, every additional increment of lane width adds distance to the crossing. That can increase the time a person is exposed to moving traffic, particularly when an intersection has multiple lanes or a broad turning area. The Toronto–Tokyo sources do not quantify pedestrian exposure, so this is a design consideration rather than a measured result from the cited analysis.
Best Value
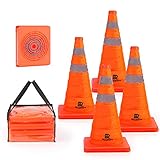
- Highly Visible: The bright orange safety color and 360 degree reflective collars make the parallel parking cones visible from a long distance during day or night
- Easy to Store: This set of collapsible traffic cones can be easily folded to a height of 0.9 inches, which is very easy to store, and there is a storage bag inside, so you can stack them when you don't need to use them, which is convenient for you to carry
- Stable: The base of cones is 9.6" X 9.6" and the weight of each road cone is 0.7 lbs, meaning that they'll stay put exactly where they need to be. Whether you're trying to control driveway traffic or keep footfall in order at a festive event
- Widely Use: These road cones can collapse up to 18 inches tall, and each cone with 2 reflective collars means people are unlikely to miss them, suitable for parking lots, driving Training, building construction, warning areas
- Sturdy PVC: We construct every tall traffic cone in this 4 pieces set from orange oxford fabric and sturdy PVC. This material is a very strong type of plastic
Very narrow lanes can create different conflicts
Below about 10 feet, drivers may have difficulty positioning a vehicle, passing a stopped vehicle or completing a turn without encroaching on another path. Buses, trucks and emergency vehicles can require additional clearance. Those operational problems help explain why the reported curve rises at the narrow end, but the sources do not identify which specific conflict produced the increase.
Width interacts with the rest of the intersection
Lane width does not operate in isolation. Corner radii, turn lanes, medians, signal timing, visibility, parking, bicycle facilities and the posted speed limit can all change how a given width functions. A measured width should therefore be interpreted alongside the complete cross-section and the way people actually use the intersection.
Independent reader supportYour contribution helps us test, update, and keep practical guides available for everyone.How to use these findings in an urban street project
The evidence is most useful as a decision process, not as an instruction to copy one number. Designers, contractors and public agencies can use the following sequence when a project changes an existing street or lays out a new one.
Quick wins for a faster PC:
Clear out junk files and repair common Windows errorsFree Scan →Fix the driver behind crashes, sound loss and screen glitchesFind Drivers →Repair Windows errors before they cause bigger problemsFix Now →- Define the operating context. Record whether the measurement applies to an intersection approach, a through segment, a turning lane, a bus lane or a temporary work-zone lane. Do not transfer an intersection value directly to a different facility type.
- Measure the built condition precisely. Document lane width at the usable travel path, not merely the distance between curb faces. Note parking, gutters, striping, drainage features, islands and any areas that reduce practical operating space.
- Check the speed environment. Record the posted speed limit and observe operating speeds where data are available. The Florida roadway-segment abstract specifically reports that lane-width effects varied by posted speed limit, so width should not be evaluated without speed context.
- Map movements and users. Count or characterize turning movements, buses, trucks, bicycles and pedestrian crossings. A width that accommodates a frequent bus route may not be appropriate for a low-volume local street, while a turning-heavy intersection may need a different treatment from a straight-through approach.
- Test whether excess width is doing useful work. If a lane is substantially wider than the surrounding context requires, ask whether the space can be reassigned to a median, pedestrian refuge, bicycle facility, loading area or other function. This is a design option to evaluate, not a conclusion mandated by the Toronto–Tokyo data.
- Check the lower bound before narrowing. Avoid reducing a lane below the range that vehicles, emergency responders and transit operations can safely use. The reported rise below about 10 feet is a warning against treating narrowness as an automatic safety treatment.
- Evaluate the whole intersection. Review sight lines, corner geometry, signal phasing, crossing distances and turning paths together with lane width. A change that looks beneficial in plan view can create a new conflict if adjacent elements are not adjusted.
- Monitor after construction. Compare speeds, conflicts, near misses and crashes over an appropriate period, using the same definitions before and after the change. A single short observation period cannot establish whether a treatment worked.
Common mistakes when applying the numbers
- Using 3.2 metres as a universal rule. The 3.2 m figure is the estimated Toronto minimum reported in a 2015 forum program. It is not a national or international standard.
- Calling all narrow lanes safer. The Building Design + Construction account says crash rates rose below roughly 10 feet as well as above roughly 10.5 feet.
- Confusing crash frequency with severity. A higher impact speed concerns how severe a collision may be; it is not the same measure as the number of collisions.
- Assuming correlation proves causation. The selected intersections may differ in traffic, geometry and surrounding land use. The reported association does not isolate lane width from those factors.
- Combining unlike studies. The Florida abstract concerns roadway segments and speed-limit-dependent nonlinear effects. It should be used as context, not presented as a direct confirmation of the Toronto–Tokyo result.
- Relying on rounded measurements. A field value near 10 feet or 3.1 metres can change depending on where the measurement starts and ends. State the measurement method and the usable width.
What the evidence can—and cannot—support
The strongest defensible conclusion is narrow: in the intersection data described for Toronto and Tokyo, lane widths above roughly 10 to 10.5 feet were associated with higher collision rates, while widths below about 10 feet were also associated with increases. The estimated minima differed slightly between the two cities, at 3.1 metres and 3.2 metres.
The evidence does not support declaring every wide lane dangerous, every narrow lane safe or one exact width suitable for every street. It also does not show that lane width alone caused Toronto’s higher reported impact speed relative to Tokyo. For a real project, the figures are a prompt to examine speed, geometry and user needs together, then verify the result with local operating and crash data.
Quick Recap
Product prices and availability are accurate as of the date/time indicated and are subject to change. Any price and availability information displayed on Amazon at the time of purchase will apply.

