Constructing an AI solution for extreme weather starts with a bounded decision, not a model. Define the hazard, geography, forecast horizon, user and action, then assemble reliable observations, a physics-based baseline, machine-learning components, verification, human review and a resilient operating plan. An AI output by itself is not an official warning or an emergency response.
This guide shows how to design such a system for construction, infrastructure and public-service work, including severe-convection and flash-flood use cases. It explains what data and sensors are needed, where AI adds value, how to test dangerous low-frequency events, and how to connect predictions to accountable warning authorities.
As an Amazon Associate I earn from qualifying purchases.
Start with the decision the system must support
“AI for extreme weather” is not one product or one model. A system may process observations, improve a numerical forecast, estimate probabilities, map hazards, detect an event in real time, summarize situational awareness or support a decision. Those are different engineering problems with different latency, accuracy and accountability requirements.
Write a one-sentence operational definition before selecting an algorithm:
#1 Best Overall

- [Color LCD Screen Weather Station] Newentor temperature & humidity monitor with a large color LCD display shows essential home weather information at a glance: indoor/outdoor temperature & humidity, daily high/low records, customizable alerts, time/date, alarm clock & snooze, weather forecast, moon phase, and barometric pressure.
- [Two Power Modes & Adjustable Backlight] To enjoy a 24/7 continuous always-on vibrant display, simply connect this home weather station to a wall outlet using the included DC power adapter. When operating on battery power only (batteries not included), the digital thermometer automatically enters an eco-energy-saving mode, where the screen lights up for a quick 15-second glance before dimming. It is the perfect bedside or living room clock designed to fit your power preference.
- [3-channel Home Weather Stations Wireless Indoor Outdoor] Wireless temperature forecast station supports up to 3 remote sensors to monitor inside outside temperature & humidity of multiple locations. Package contains one remote sensor.
- [Wireless Forecast Station] The weather forecast station calculates the weather forecast for the next 12-24 hours, 7 to 10 days calibration ensures an accurate personal forecast for your location.
- [Wireless Weather Station with Atomic Time&Date] Atomic alarm clock weather station can be used not only as a wireless indoor outdoor thermometer but also as an atomic clock with dual alarms.
For [user], in [geography], detect or forecast [hazard] at [spatial and temporal resolution] up to [lead time], so the user can take [specific action].
For a construction company, examples include pausing crane work when severe wind probability exceeds a threshold, moving crews and equipment before a flash flood reaches a site, or producing a 0–6-hour convective-risk map for a regional operations center. A public warning issued to residents is a separate task owned by the appropriate meteorological or hydrological service.
Specify the hazard and horizon
- Hazard: severe convection, hail, damaging wind, lightning, intense rainfall, river flooding, debris flow or another defined threat.
- Geography: one worksite, a river basin, a city, a transport corridor or a national domain. Terrain, coastlines and urban surfaces alter both observations and impacts.
- Horizon: minutes for detection, hours for nowcasting, days for forecasts, or seasons for planning.
- User and action: site supervisor, emergency manager, utility dispatcher, forecaster or the public; identify what they will do with the output.
- Decision costs: estimate the consequences of a missed event versus an unnecessary shutdown. A threshold that is sensible for protecting a crane may be unsuitable for a public evacuation.
Design the end-to-end architecture
Treat the project as a chain with observable interfaces rather than as a black-box model. A practical architecture has six layers:
- Observation layer: ingest surface stations, radar, satellite, hydrological gauges, soil-moisture sensors, lightning data, event reports and reanalysis.
- Quality-control layer: check timestamps, units, locations, sensor status, outliers, gaps and changes in instrumentation before features reach a model.
- Forecast and detection layer: run a conventional numerical or hydrological model, an ML model, or a hybrid of both.
- Hazard layer: convert predictions into probabilities, exceedance maps, flood footprints or other task-specific products.
- Decision layer: apply thresholds agreed with operational users, display uncertainty and record the model version and issue time.
- Action and audit layer: deliver outputs through existing protocols, log overrides and outcomes, and retain data for verification and retraining.
Separating these layers prevents a common failure: allowing an attractive probability map to become an unreviewed warning. National meteorological and hydrological services retain authoritative warning roles, while local officials and site managers provide context that a model cannot infer from data alone.
Build a defensible observation inventory
Data quality and coverage usually constrain performance more than the choice between two fashionable architectures. The World Meteorological Organization (WMO) states that machine-learning performance depends on data quality and an appropriate model architecture. Sparse observations are a design constraint to quantify, not a limitation to conceal.
Inventory each data source
- Surface networks: precipitation, temperature, pressure, humidity and wind, with station metadata, calibration history and maintenance records.
- Remote sensing: weather radar, geostationary and polar-orbiting satellites, lightning networks and, where appropriate, drone observations.
- Hydrological measurements: river stage, discharge, soil moisture, reservoir levels and channel characteristics.
- Historical event records: verified hail, wind, rainfall and flood reports with time, location, severity and uncertainty.
- Reanalysis and model fields: gridded atmospheric histories that provide broader context where local observations are sparse.
For every feed, record coordinates, elevation, sampling interval, units, latency, missingness, quality flags, ownership, access rights, retention rules and known changes in hardware or processing. A model trained on a station network that later moved or changed sensors can mistake an instrument change for a weather signal.
Rank #2
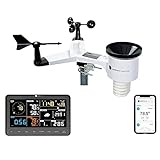
- COMPLETE WEATHER STATION: (1) Osprey Sensor Array with Rain Cup, and (1) Brilliant, Easy-to-Read LCD Color Display
- AUTHENTIC HYPER-LOCAL DATA: Monitor your actual home and backyard weather conditions with our wireless and Wi-Fi-enabled sensor array measuring wind speed/direction, temperature, humidity, rainfall, UV intensity, and solar radiation
- SMART HOME READY: Set up alerts, access your data remotely, and program your home based on weather conditions using IFTT, Google Home, Alexa, and more
- ENHANCED WIFI: Enables your station to transmit its data wirelessly to the world's largest personal weather station network (optional setting)
- JOIN THE COMMUNITY: Connect to Ambient Weather Network to customize your dashboard tiles, share hyperlocal weather conditions via social feeds and create your own forecasts (coming soon)
WMO’s Georgia severe-convection example combines available local observations with the US NOAA Storm Events Database, which contains 70 years of records, and ECMWF ERA5 reanalysis. The approach uses transfer learning from data-rich regions and Weather Research and Forecasting (WRF) downscaling. Georgia’s complex topography makes hail and windstorm prediction particularly difficult; the case is evidence of a design pattern, not a guarantee that the same transfer will work elsewhere.
Quick wins for a faster PC:
Repair Windows errors before they cause bigger problemsFix Now →Scan for outdated or missing drivers - takes under a minuteDriver Scan →Clear out junk files and repair common Windows errorsFree Scan →Choose sensors for the variable you need
For a flash-flood detector, rainfall alone may be insufficient. WMO’s Colima River basin case combines hydrological stations, RiverCore river-stage and soil-moisture sensors, and weather stations. The basin spans elevations from 100 to 4,300 metres, so placement and terrain representation matter. A local weather station with a rain gauge and anemometer can support a prototype or learning system, but the cited case does not validate consumer equipment for public warnings. Select hardware by target variable, siting, calibration, communications, uptime and maintenance requirements.
Assign AI a role alongside physical models
Retain a conventional forecast or hydrological baseline. It gives you a reference for skill, a fallback during ML outages and a way to detect physically implausible outputs. AI can add value in several bounded roles:
- Observation quality control: identify suspect readings or fill short gaps with confidence flags.
- Post-processing: correct systematic bias in a numerical forecast and produce calibrated probabilities.
- Downscaling: translate coarse atmospheric fields to a site or basin scale, provided local validation supports the added detail.
- Event detection: classify radar, gauge or satellite patterns as likely severe convection or flooding.
- Data fusion: combine heterogeneous sensors and event records into a coherent hazard estimate.
- Decision support: rank sites or assets by expected impact while exposing uncertainty and data age.
Hybrid systems can combine physical constraints with learned components. ECMWF’s 2025–2034 strategy describes its Artificial Intelligence Forecasting System (AIFS) as trained on many years of reanalysis while using traditional data assimilation, and anticipates increasing use of hybrid approaches. This supports a gradual transition, not a claim that AI has replaced physical forecasting.
Develop representative training and test sets
Extreme events are rare, unevenly observed and often clustered in particular seasons or terrain. Randomly splitting rows from one period can leak nearly identical weather situations into both training and test sets, producing an inflated score.
Free tools Windows power users keep installed
One-click scans. No signup required.
- Define the event label: set thresholds for hail size, wind gust, rainfall intensity, river stage or inundated area, and document who verified each label.
- Split by time and location: hold out later seasons and, where possible, entire stations, sub-basins or regions to test geographic transfer.
- Preserve the tail: report results by severity, not only an all-weather average. Include missed high-impact events and false alarms during benign periods.
- Track lead time: evaluate every operational horizon separately; a useful 15-minute detector may not support a six-hour decision.
- Version the pipeline: store the exact inputs, transformations, model weights, thresholds and software used to generate each output.
If labels are incomplete, say so. A database of reported storms is not a complete census of every storm, and a missing gauge reading is not proof that no rain occurred.
Rank #3
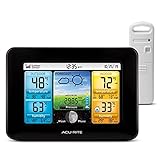
- Simple Setup and Use: Install 2 AA batteries (not included) in the outdoor weather station sensor and easily hang on a post or tree branch using the integrated hanger to begin receiving your weather forecast and hyperlocal conditions
- Real-Time Weather Conditions: This indoor outdoor weather station has an indoor temperature gauge and an outdoor temperature thermometer for indoor and outdoor temperature, humidity, and barometric pressure trends from an outdoor temperature sensor
- Weather Forecast and Forecasting Technology: The outside temperature thermometer wirelessly relays data to provide a hyperlocal, personalized weather forecast 12 hours from your current conditions, so you can plan your la crosse or other sports game!
- Illuminated LCD Color Display: Easy-to-view digital indoor outdoor thermometer display has an adjustable dimmer to make for the perfect addition to your home technology and allows easy placement anywhere in the house, office, or as an RV weather station
- Dynamic Forecast Icons and Moon Phase: With multiple thermometers & weather instruments data, this digital indoor outdoor thermometer display has trend arrows and provides the current moon phase to further impact your weather monitoring capabilities
Verify the dangerous tail, not just average accuracy
Verification must match the task. For deterministic forecasts, use appropriate error measures; for probabilities, assess calibration and discrimination; for maps, evaluate spatial overlap and displacement. Always pair aggregate scores with event-level examples and false-alarm rates.
Metrics for detection and flood footprints
In the Colima flash-flood case, authors compare machine-learning detection with hydrological and hydraulic models and report overall accuracy, F1-score and Intersection over Union (IoU). Accuracy can be misleading when non-flood pixels dominate, so F1 and IoU help expose missed or overpredicted flooded areas. Reproduce the same definitions and class thresholds before comparing your result with that case.
Evaluation dimensions required for deployment
- Robustness: does performance survive missing sensors, latency, unusual storms or a changed instrument?
- Generalization: does it work in a new season, basin, terrain or climate regime?
- Scale-up: can latency and compute remain acceptable when covering more sites?
- Regional fairness: are error rates materially worse in poorly observed or marginalized areas?
- Physical consistency: do outputs respect conservation, plausible storm evolution and known hydrological constraints?
- Operational value: does the output improve a real decision compared with the existing baseline?
Michel Jean and co-authors write that AI-based Earth System Prediction models rely on training data rather than physical equations, creating challenges in “evaluating their robustness, the feasibility to generalize or scale up, fairness across regions, and physical consistency with established dynamical principles.” That is a verification agenda, not a reason to publish one cross-hazard accuracy number. The official material summarized here provides no single statistic proving that AI is more accurate for extreme weather overall.
Compare approaches using the same decision criteria
| Criterion | AI or ML component | Physics-based model | Hybrid design |
|---|---|---|---|
| Typical strength | Fast pattern detection, post-processing and probability estimation | Explicit physical equations and established data assimilation | Learned corrections or emulators constrained by physical forecasts |
| Data requirement | Large, representative historical data; sensitive to gaps and bias | Observations plus model parameters and computational resources | Both historical examples and a trusted physical baseline |
| Rare-event risk | Can underrepresent extremes unless sampling and loss functions address them | Can be expensive or biased by parameterization, but offers physical structure | Allows targeted learning while retaining constraints |
| Transfer across geography | Must be tested; transfer learning may help but is not guaranteed | Often broader physical portability, still requiring local calibration | Potentially more portable if local observations constrain the learned part |
| Explainability | Requires feature, uncertainty and provenance displays | Equations and parameter assumptions are explicit | Needs documentation for both components |
| Failure fallback | Requires a maintained baseline and stale-data safeguards | Can continue if observations and compute remain available | Can degrade to the physical component when ML is unavailable |
Choose by hazard, horizon, resolution, uncertainty calibration, connectivity, compute, auditability and the capacity of the local service—not by a generic claim that one category is best.
Integrate forecasters, authorities and field users
Design the interface around decisions. Every displayed result should show issue time, valid time, location, source data age, model and version, probability or severity category, uncertainty and known limitations. A site supervisor needs a clear action threshold and an explanation of whether the signal comes from a gauge, radar, forecast or inferred variable.
Run exercises with forecasters, emergency managers and construction personnel. Test what happens when a model disagrees with a trained forecaster, when a warning is revised, and when communications fail. Log human overrides and the evidence behind them; those records support later evaluation without pretending that the model alone caused the outcome.
Rank #4

- Comprehensive Weather Information: One of the best weather stations, receive over 55 data points that allow you to monitor historical data, the heat index, dew point, feels like temperature, pressure trends with trend arrow, and more
- Real-Time Weather Conditions: Look no further for the perfect indoor and outdoor weather station! Wirelessly receive readings for indoor/outdoor temperature and humidity, wind speed/direction, barometric pressure, and rainfall directly to your home weather station
- Easiest Setup on the Market: Just install batteries, attach the wireless outdoor sensor to a pole or post using the included mounting bracket, and you’re ready to be the neighborhood weather expert
- Weather Clock: The indoor weather station display is a large, color LCD Display with the current time, date, and an adjustable dimmer, making it convenient to read and easily view indoor and outdoor data, time, and conditions
- Weather Forecast: The outdoor weather station collects elevation data and combines it with barometric pressure data from the indoor weather station to provide a personalized weather forecast 12 hours from your current conditions
WMO emphasizes transparency, interoperability, shared standards and the authoritative voice of national meteorological and hydrological services. Human judgment remains essential for interpreting forecasts in real-world context. An AI-generated narrative must not silently become an official warning.
What’s actually slowing this PC down?
Pick the symptom - the matching free tool is one click away.
Engineer for operations, outages and local capacity
Minimum operational safeguards
- Health checks for every sensor and data feed, with explicit stale-data alarms.
- Automatic fallback to the conventional forecast or a last-known safe operating procedure.
- Redundant storage and time-synchronized logs for observations, outputs and alerts.
- Access control, encryption, patching and incident response for cloud and field devices.
- Monitoring for drift in input distributions, event frequency, calibration and regional error.
- A retraining policy that requires review, validation and rollback rather than automatic replacement.
- Documented contacts and escalation paths for meteorological, hydrological and emergency authorities.
Budget for sensor maintenance, communications, compute, cybersecurity, staff training, model monitoring and periodic re-verification. A system that works in a demonstration but fails during a power or network outage is not an early-warning service.
Use pilots as capacity examples, not guarantees
WMO reports a Malawi pilot in which MET Norway uses shared cloud resources under ECMWF’s Forecast-in-a-Box concept so local meteorologists can run advanced models. The organization also describes flood-forecasting pilots in Nigeria, Viet Nam, Uruguay and the Czech Republic. These are examples of deployment approaches, not proof that every region has equal connectivity, staffing, data quality or outcomes. Plan local training, ownership and an offline or low-bandwidth operating mode from the beginning.
A staged implementation plan
- Scope: choose one hazard, area, decision, lead time and accountable user; define success and unacceptable failure.
- Baseline: implement the existing numerical, hydrological or rule-based method and establish current false-alarm and miss rates.
- Data audit: map sensors and external datasets, rights, latency, gaps, calibration and geographic blind spots.
- Prototype: add one bounded ML function, such as quality control, post-processing or detection, with uncertainty output.
- Independent verification: use held-out times and locations, severity strata and event-based metrics; compare with the baseline.
- Human exercise: run historical replay and live shadow operations with forecasters and field users before enabling automated actions.
- Pilot: publish advisory outputs, monitor drift and outages, and require human approval for warnings or shutdowns.
- Scale carefully: expand geography only after regional fairness, physical consistency, latency and fallback tests pass.
Common failure modes and corrections
“We need an AI model” before defining the action
Correction: write the hazard, user, horizon, threshold and consequence of error first. A flood-footprint detector and a seven-day outlook cannot share one success metric.
Training on convenient but unrepresentative data
Correction: quantify missing observations, add quality flags, seek complementary remote sensing or reanalysis, and report where coverage is too sparse for a reliable claim.
Crashes, No Sound, or Screen Glitches?
Random freezes, missing sound and display glitches usually trace back to one bad driver. Find and replace yours safely.Free scan · under a minutePC Slower Than It Used to Be?
A free scan shows the junk files, broken settings and background clutter dragging Windows down - then fixes them in one click.Free scan · Windows 10 & 11Promoting a prototype sensor to warning authority
Correction: validate siting and calibration, add redundancy, and keep official issuance with the responsible meteorological or hydrological service.
Best Value
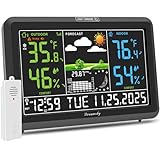
- Illuminated Indoor Outdoor Weather Station for Home with Large Colorful Display: The home weather station delivers large big numbers for weather forecast info, indoor outdoor temperature, atomic time, date, year and calendar day, which is super easy to read from afar.
- Indoor outdoor Thermometer Wireless with High/Low Temperature Alert: The digital weather station supports 3 outdoor sensors which helps to monitor temperature and humidity of multiple locations (one sensor included). With the high/low temperature alert function, the weather station clock keeps you informed about the changes of weather thermometer outdoor.
- WWVB Atomic Weather Station with Auto DST: Weather atomic clock with indoor/outdoor temp always keeps precise time and date by receiving the WWVB atomic signal. The self setting digital weather clock will automatically adjust to daylight saving time with auto DST feature, no more resetting twice a year.
- Personal Weather Forecast Station: This weather stations wireless indoor outdoor predicts the next 12-24 hours weather condition with a 7-day calibration through the pressure of your location which provides you a better outing experience.
- 5 Level Adjustable Backlight Brightness: The weather clock indoor outdoor temperature atomic with backlight dimmer function helps you avoid high-intensity light that disturb your sleep and easily check the weather situation during the day.
Reporting one impressive average score
Correction: publish severity-, region- and lead-time-stratified results, calibration, false alarms, misses and comparisons with physical baselines.
Ignoring physical plausibility
Correction: add physical constraints or hybrid components, inspect impossible gradients and mass-balance violations, and define a human review trigger.
Deploying without a fallback
Correction: test stale-data, sensor-loss, cloud-outage and cybersecurity scenarios; document who switches to the backup and how users are notified.
Recommended Free Tools
What a responsible result looks like
A responsible extreme-weather AI system states exactly what it predicts, where, when and for whom; identifies the observations supporting it; reports uncertainty and known blind spots; proves value against a maintained baseline; and fits the warning authority’s procedures. It may improve detection, downscaling, probability estimates or situational awareness without replacing physical forecasting or professional judgment.
For construction and infrastructure teams, the practical objective is not an impressive model score. It is a traceable decision process that gives crews enough reliable lead time to secure equipment, stop hazardous work, protect people and restart safely when conditions improve.
Quick Recap
Product prices and availability are accurate as of the date/time indicated and are subject to change. Any price and availability information displayed on Amazon at the time of purchase will apply.

