Outdated Drivers Are Slowing You Down
One free scan finds every outdated or missing driver and matches the right update for your exact hardware.Free scan · exact hardware matchPC Slower Than It Used to Be?
A free scan shows the junk files, broken settings and background clutter dragging Windows down - then fixes them in one click.Free scan · Windows 10 & 11Educational institutions can use data to make better facility decisions—but only when each dataset is tied to a specific choice. Enrollment trends, room use, building condition, travel patterns and stakeholder input can reveal where to add, reuse, relocate or phase space. Data does not replace professional judgment or community priorities; it makes those decisions more transparent and testable.
What data-driven design means in an education setting
Data-driven design is a planning discipline, not a software purchase. The process starts by identifying a decision—such as whether to renovate a science wing, consolidate programs or build additional classrooms—and then selecting the smallest set of reliable information that can improve that decision.
As an Amazon Associate I earn from qualifying purchases.
The June 8, 2018 article “Data is driving design for education,” published by Building Design + Construction under HDR’s byline, presents this as an industry perspective for K–12 and higher-education institutions. It argues that a constant flow of information becomes useful only after it is curated, connected and interpreted in context. The article does not report a controlled study, a quantified saving or a validated software platform. Its suggestions should therefore be used as a planning framework rather than as proof that a particular data practice will produce a specific outcome.
The Tool Desk
Outbyte Driver Updater FREEFix the driver behind crashes, sound loss and screen glitchesFind Drivers →Outbyte PC Repair FREEClear out junk files and repair common Windows errorsFree Scan →- Start with a decision: Define what must be decided, by whom and by when.
- Curate relevant streams: More data can create noise, privacy risk and false precision.
- Combine quantitative and qualitative evidence: Counts and maps need to be checked against the experience of students, staff and faculty.
- Show assumptions: A scenario is only as credible as its definitions, time period and data quality.
- Plan for change: Teaching methods, technology, enrollment and community needs will continue to evolve.
Which facility decisions can data inform?
Enrollment and growth planning
Enrollment history, program demand, age-cohort projections and course-registration patterns can help a district or institution test whether existing capacity will be sufficient. The useful question is not simply “How many students will there be?” It is “Where, when and in which programs will demand occur, and what type of space does that demand require?” A projected increase in a specialized program may call for laboratories or workshops rather than a generic classroom addition. A stable headcount with a changing grade mix may require rebalancing space instead of expanding the campus footprint.
#1 Best Overall

- Valued Carpenter Pencil Set: You will get 2 pcs solid carpenter pencils with 26 piece 2.8 mm refills, 1 replaceable sharpener, 1 plastic storage box.The complete carpenter pencils combination allows you to finish your work faster and more easily
- Deep Hole Marker Pencil: The deep-hole construction pencils adopts 45mm elongated tip design, which is more convenient to mark in the small hole or in other tight areas that other carpenter markers cannot reach
- Carpenter Pencils with Sharpener: The sharpener is screwed into the top of the work pencil, which won't get lost either. Built-in pencil sharpener that keep the lead with pointed and smooth to Improves line of sight in fine work
- Stronger Solid Lead: This work pencil is matched with a 2.8 mm thick lead , which is much thicker and stronger during the drawing process of construction work, it will not break or damage easily
- Marks on Various Surfaces: 3 colors solid construction pencil can marks on various surfaces,such as metal, plastic, wood, paper etc. Ideals for woodworkers, contractors, craftsmen, builders, merchants and masons
Space requirements and reassignment
A room inventory can be compared with schedules, observed occupancy and functional requirements. This can reveal rooms that are heavily booked, spaces reserved for occasional use, or areas whose layout no longer matches the activity taking place there. Reassignment may be preferable to new construction when a room can be adapted safely and without undermining another program. Any conclusion should state the observation period and distinguish scheduled use from actual use; a timetable alone does not prove that a room is occupied.
Reuse and renovation
Building-condition assessments, accessibility reviews, energy information and program needs can be viewed together to identify candidates for renewal. A facility with good structural capacity but obsolete services may be a strong renovation candidate. Conversely, a building with severe envelope, code or infrastructure constraints may carry a higher long-term risk even if its rooms appear busy. Data helps expose those trade-offs; it does not make the engineering or cost judgment on its own.
Functional and collaborative zoning
Schools and campuses can map which activities need quiet concentration, specialist equipment, secure circulation, public access or frequent collaboration. Overlaying those needs with departmental relationships and movement patterns can inform adjacencies, shared hubs and separation of incompatible uses. The aim is to support the work people actually do, rather than preserve organizational boundaries that no longer reflect teaching or research practice.
Quick wins for a faster PC:
Clear out junk files and repair common Windows errorsFree Scan →Scan for outdated or missing drivers - takes under a minuteDriver Scan →Infrastructure priorities and capital budgets
When a capital program contains more needs than available funding, a common evidence base allows leaders to compare urgency, risk, mission impact and implementation complexity. A dashboard can make the trade-offs visible, but it cannot establish that a project will save a particular amount or improve learning. The 2018 article makes possibilities for efficiency, control and collaboration; it does not provide measured outcome figures.
Rank #2

- Ergonomically Designed: Work in tight areas with a compact design that gets into tough spots
- Both tools are designed to fit into difficult to reach spaces
- Complete a wide range of applications with a high-performance motor that delivers up to 300 UWO, and an impact driver delivering up to 1,400 in-lbs of torque
- Both the DEWALT impact driver and drill driver feature integrated LED work lights with a convenient 20-second delay, ensuring enhanced visibility in dimly lit or challenging work areas
- One-Handed Loading - Keep one hand free with a 1/4 in. hex chuck that accepts 1 in. bit tips
Trend mapping
Mapping changes over time—such as program growth, commuting patterns, room demand or the location of informal gathering—can show whether a one-time fix will remain useful. Trend maps should include dates and confidence levels. A single unusual semester should not be treated as a permanent shift.
| Data signal | Decision it can inform | Possible design response | Important qualification |
|---|---|---|---|
| Enrollment by grade, program or location | Capacity, phasing and site strategy | Add, convert, share or phase space | Forecasts are scenarios, not guarantees |
| Schedules and observed room use | Reassignment and utilization questions | Change timetables, layouts or room mix | Scheduled occupancy may differ from actual occupancy |
| Building condition and code information | Renewal, replacement and risk ranking | Repair, renovate, replace or monitor | Verify findings through professional assessment |
| Program relationships and movement paths | Adjacency and zoning | Cluster compatible uses and reduce conflicts | Include accessibility, safeguarding and operational constraints |
| Transit, demographics and community patterns | Site access and public-facing functions | Adjust entrances, services and shared amenities | Protect personal information and avoid stereotyping |
Build an evidence base people can trust
Inventory the streams before choosing a tool
Begin with a register that names the owner, format, date range, refresh cycle and permitted use for every dataset. Potential inputs include enrollment and registration records, room and timetable inventories, occupancy observations, facility-condition reports, maintenance history, accessibility audits, transportation information, demographic summaries, stakeholder interviews and workshop notes. The list should be intentionally selective. If a stream cannot change a decision, it may not belong in the first planning cycle.
Define terms and time windows
“Utilization,” “capacity,” “available,” “shared” and “underused” can mean different things to different departments. Establish definitions before combining records. A room that is empty between scheduled classes may be intentionally reserved for specialist preparation. A building that appears available may be inaccessible during construction or unsuitable for the activity being planned. Record the relevant hours, season, academic calendar and exceptional events.
Address privacy and stewardship
Education data can identify individuals or sensitive groups. Use aggregated counts wherever possible, restrict access by role, document retention periods and remove fields that are not needed for the decision. Demographic information should help reveal unequal access or service needs, not justify assumptions about a community. Invite affected groups to review interpretations before a proposal is finalized.
Rank #3

- 【Great Compatibility】This Katerk 1/4 inch hex shank bit holder is specifically designed for 1/4 inch hex shank drill bits. It's compatible with most 1/4 fast hex handles, hex sockets, various electric screwdrivers, and handheld screwdrivers. The bit holder makes it a valuable addition for any handyman.
- 【Secure and Safe】Built with a secure backup nut design, each drill bit holder securely locks onto your bits, ensuring they stay firmly in place. Additionally, our bit holder incorporates a high-quality steel ball rolling design that holds up to several kilograms of weight, ensuring your various drill bits don't fall off.
- 【Easy One-Handed Operation】The bit holder for impact driver allows you to change bits single-handedly, simplifying your workflow. Its multi-color design further allows for quick identification of the drill bit you need.
- 【Compact and Convenient】Thanks to its compact size, this 1/4 inch bit holder is easy to carry around. The bit holder allows for easy attachment to various tools, making this a convenient addition to your construction accessories. The Katerk bit holder is cast from high-quality alloy material, promising a long product lifespan. Despite its rugged strength, the bit holder remains lightweight, making it portable.
- 【Cool Christmas Gift For Men Stocking Stuffers】 This screwdriver bit holder, driver bit holder, impact bit holder, can be given as a gift to your loved one, especially for anyone involved in construction or electrical work. It's a must-have for stocking stuffers for men and women, tools gifts for dad, tech gadgets for men, gifts for dad, gifts for him, gifts for husband, gifts for boyfriend, cool gadgets for men, and cool gifts for dad.
Connect every chart to an action
A useful register pairs each metric with a decision owner, threshold or question. For example, “rooms with less than 30 percent scheduled use” is not a conclusion; it is a prompt to check scheduling rules, room suitability, peak demand and strategic reservation. This discipline prevents a dashboard from becoming a gallery of attractive but disconnected charts.
Use proximity as more than a floor-plan measurement
The article’s framework treats proximity as multidimensional. Physical distance matters, but so do organizational relationships, social interaction and institutional priorities. Designers can use the following lenses together:
| Dimension | Questions to ask | Evidence to examine | Design implication |
|---|---|---|---|
| Physical | Which destinations must be reached quickly or frequently? | Travel paths, accessibility routes, delivery and safety requirements | Place compatible, high-frequency uses closer together; protect secure or quiet zones |
| Organizational | Which teams share equipment, services or decisions? | Workflows, reporting relationships, shared-resource bookings | Create adjacencies or shared support spaces without assuming departments must merge |
| Social | Where do informal exchange and belonging occur? | Observation, interviews, gathering patterns and student feedback | Provide welcoming, legible places for planned and unplanned interaction |
| Institutional | Which locations express mission, access and community connection? | Strategic priorities, public access, partnerships and governance | Align prominent spaces and investment phases with stated institutional goals |
Visibility, zoning, demographics, social networks, diversity, organizational culture, transit, spatial integration and informal gathering places can all be considered within these lenses. None should be treated as a universal formula. A highly visible space may support orientation in one setting and undermine privacy in another; a shared hub may encourage collaboration but create noise or supervision challenges.
What’s actually slowing this PC down?
Pick the symptom - the matching free tool is one click away.
What a consolidated dashboard should do
A consolidated visualization is useful when stakeholders need to inspect intersecting trends rather than isolated spreadsheets. It should let users move from a campus or district overview to the underlying room, program or condition record, while preserving date ranges and definitions.
Rank #4

- Long Nib and Deep Hole Marker: Our mechanical carpenter pencil with 45mm nib is designed for easy marking of deep holes or narrow areas. These construction pencils are the great choice for woodworking tools, construction tools, carpenter tools, contractor tools, wood carpentry tools and architect tools
- Extra Refills in 2 Colors for Versatile Marking: The construction mechanical pencil comes with 12 extra 2.8mm refills, including 6 red and 6 black refills. The black refill is suitable for light surfaces, while the red wax is perfect for dark surfaces. Our carpenter mechanical pencil makes sure that you'll have an ample supply for extended use
- Built-in Sharpener: Our construction pencil comes with a built-in sharpener to ensure the mechanical pencil tip is always sharp and ready for use. Never buy an extra pencil sharpener again. A great tool for any woodworker pencil, contractor pencils. The refill can easily be extended or retracted with a simple click of the pencils mechanical, allowing you to work more efficiently and accurately
- Portable Clip Design: Our deep hole construction pencil features a portable clip design, easy to carry and attach to your pocket or tool box, so that you can keep the carpenter pencils mechanical close at hand, making it a convenient tool to have on the go. Great gifts choice for carpenters
- Stronger Pencil Lead: The black refills are made of lead, sturdy and smooth. The red refills are made of wax, clear and light. These marking pencils are much thicker and stronger than normal pencils during the marking process of construction work, suitable for various surfaces, such as glasses, metal, boards, floors, walls, furniture, etc. The written marks can be easily wiped with a wet paper towel when needed
- Show a decision view: Organize screens around capacity, renewal, access or another approved question.
- Make time visible: Display the period covered, update date and whether values are actuals, forecasts or scenarios.
- Expose uncertainty: Flag missing records, small samples and assumptions instead of presenting false precision.
- Support map and list views: A map reveals spatial relationships; a table supports auditing and export.
- Record provenance: Each figure should identify its steward and source system.
- Control permissions: Sensitive student, staff or security information should not be visible to every user.
- Enable scenario comparison: Let stakeholders compare options such as renovate, reassign, build or defer, with costs and constraints clearly labeled.
The 2018 article does not name, compare or validate a specific dashboard product. Institutions should select or build tools only after agreeing on data definitions, governance and the decisions the visualization must support.
A practical workflow from data to design decision
- Frame the decision. Write the decision statement, deadline, budget boundary, responsible authority and non-negotiable requirements.
- Set success criteria. Define what a viable option must achieve—for example, adequate specialist capacity, safe circulation, accessibility and a deliverable construction phase.
- Assemble a baseline. Gather the minimum relevant records and document owners, dates, definitions, gaps and privacy controls.
- Map activities and relationships. Combine spatial information with schedules, workflows, movement, stakeholder needs and the four proximity dimensions.
- Test scenarios. Compare reuse, reassignment, renovation, new construction and phased options. Keep assumptions and exclusions visible.
- Validate with users. Review findings with students, educators, facilities staff, administrators and community representatives who understand local conditions.
- Translate into a capital plan. Sequence projects by risk, dependencies, funding windows, procurement lead times and the ability to keep services operating.
- Monitor and adapt. After implementation, check whether the original assumptions remain valid and define triggers for a timetable, layout or infrastructure adjustment.
Design facilities that can adapt
Because teaching practices and technologies change, flexibility should be treated as a performance requirement rather than a vague aspiration. Early planning can separate elements with different replacement cycles: structure and floor-to-floor height may last for decades, while furniture, partitions, information technology and specialist equipment change much sooner.
- Provide accessible routes and service zones that allow layouts to change without major demolition.
- Use rooms and furniture that can support more than one teaching mode where acoustics, safety and equipment allow.
- Plan power, data, ventilation and lighting capacity for foreseeable changes, while avoiding unnecessary overbuilding.
- Protect shared spaces from being claimed permanently by one program unless governance explicitly permits it.
- Phase work so that essential teaching and community services can continue during construction.
- Document the assumptions behind each flexible feature so future teams know what can be changed safely.
Use data to discuss efficiency without overpromising
Data can improve the quality of a capital conversation by showing why a project is urgent, what alternatives were tested and which assumptions drive cost. It cannot guarantee efficiency, innovation, collaboration or budget savings. Those outcomes depend on procurement, operations, maintenance, staffing, behavior and conditions that may not be represented in a planning dataset.
Do these 3 things before closing this tab:
1Repair Windows errors before they cause bigger problems2Scan for outdated or missing drivers - takes under a minute3Clear out junk files and repair common Windows errors| Decision question | Evidence to present | What not to claim |
|---|---|---|
| Should space be added? | Demand by time and program, current capacity, constraints and forecast range | That a forecast is certain |
| Should a building be reused? | Condition, code, accessibility, service capacity and adaptation cost | That reuse is automatically cheaper or greener |
| Which project comes first? | Risk, mission impact, dependency, readiness and funding window | That a ranking alone proves return on investment |
| Will a shared hub help? | Activities, users, circulation, supervision and operating plan | That proximity will necessarily increase collaboration |
Common failure modes and their fixes
- Collecting everything: Limit the first release to data tied to named decisions; add streams only when they answer an unresolved question.
- Confusing a proxy with the goal: Room counts or movement totals do not measure learning, belonging or quality by themselves. Pair proxies with user feedback and professional judgment.
- Ignoring the calendar: Compare equivalent weeks or terms and explain unusual events such as examinations, closures or temporary relocations.
- Treating forecasts as facts: Publish a range of scenarios and the assumptions that would cause each to change.
- Letting the dashboard decide: Use visualizations to structure deliberation; retain accountable human approval for design, safety and capital commitments.
- Overlooking local character: A model copied from another district may miss culture, geography, demographics, governance and community use. Adapt the method locally.
- Failing to revisit assumptions: Assign an owner and review date so that obsolete data does not quietly drive later phases.
Illustrative scenario: deciding whether to add classrooms
Consider a district that sees rising demand at one campus while another nearby building has rooms that appear lightly scheduled. The planning team first separates grade-level projections from actual room use and checks whether the lightly scheduled rooms are suitable, accessible and available during the required hours. It then maps travel, safeguarding, specialist-equipment needs, staff workflows and community access.
Best Value
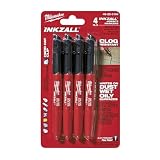
- Milwaukee Ink all Fine Point Marker, Black, 4 Per Pack
- 4 per pack Features Clog Resistant Marker Tip Writes through Dusty, Wet and Oily Surfaces Durable Marker Tip for Writing on Concrete, OSB and Rough Surfaces
- Clog resistant tip writes on dusty, wet and oily surfaces and is optimized for rough surfaces such as OSB, cinderblock and concrete
- Hard hat clip- attaches for easy access
- Quick dry time with reduced smearing and marking
Three scenarios can be tested: reassign selected rooms, renovate the existing building to support the growing program, or construct an addition in phases. Stakeholders review each scenario against capacity, disruption, infrastructure, cost timing and long-term adaptability. The preferred option is not “the one with the highest utilization.” It is the option whose documented assumptions, risks and community priorities are acceptable to the decision-makers, with monitoring triggers defined for the next enrollment cycle.
Planning references and the limits of the evidence
The Association for Learning Environments (A4LE) describes Creating Connections: The CEFPI Guide for Educational Facility Planning as a resource containing foundational material, best practices, examples and reproducible forms. Its official description states: “Each district must develop its own approach to facility planning, to address the unique character of its community and schools.” That principle fits a data-led process: use a common discipline for documenting choices, but tailor measures and engagement to the district or institution.
The A4LE store page displayed a price of $85 when accessed; price, edition and availability can change, so confirm those details directly before purchase. The guide is a planning reference, not a data platform or a guarantee of project outcomes.
Free tools Windows power users keep installed
One-click scans. No signup required.
The central lesson from HDR’s 2018 article is therefore practical rather than statistical: organize relevant evidence around real facility decisions, make relationships and assumptions visible, involve the people affected, and design buildings that can change as education changes.
Quick Recap
Product prices and availability are accurate as of the date/time indicated and are subject to change. Any price and availability information displayed on Amazon at the time of purchase will apply.

