Some links on this page are affiliate links: if you buy through them we may earn a commission, at no extra cost to you.
The most durable campus energy reductions come from three coordinated moves: retrofit and tune existing buildings, operate equipment against real occupancy and schedules, and evaluate shared heating and cooling infrastructure at campus scale. The right order depends on building types, equipment condition, climate, utility rates, laboratory and clinical requirements, and available capital—not on a universal ranking.
What are the three strategies?
A campus should treat energy reduction as a facilities program rather than a single equipment purchase. Start by improving the buildings you already have, then make sure schedules and controls do not waste the improvements, and finally test whether a shared thermal system can serve several buildings more efficiently than separate replacements.
As an Amazon Associate I earn from qualifying purchases.
The Tool Desk
Outbyte PC Repair FREERepair Windows errors before they cause bigger problemsFix Now →Outbyte Driver Updater FREEScan for outdated or missing drivers - takes under a minuteDriver Scan →| Strategy | Primary decisions | Best fit | Evidence and limits |
|---|---|---|---|
| Retrofit and tune buildings | Lighting, HVAC, air handling, controls, sensors and envelope work as a package | Buildings with obsolete equipment, poor control sequences or high energy intensity | Documented projects show large savings in individual buildings; results are not a campus-wide guarantee |
| Manage operations, schedules and controls | Occupancy alignment, set-point policy, space audits, alarms and performance monitoring | Buildings whose systems run when rooms are empty or drift from intended settings | A 2010 simulation estimated 5–15% lower HVAC energy use with actual-occupancy estimates; this was not measured campus-wide |
| Plan campus-scale heating and cooling | Shared heat pumps, geothermal loops, district systems, storage, generation and microgrids | Multi-building campuses facing major plant replacement or resilience goals | Case results are site-specific; economics depend on geology, utility arrangements, design and capital |
Strategy 1: Retrofit and tune existing buildings
Buildings usually offer the fastest place to find avoidable consumption because lighting, air handling, heating, cooling and controls interact. An efficient lamp cannot compensate for an air-handling unit that runs at full speed all night, and a new chiller will underperform if sensors or sequences are wrong. Treat the work as a coordinated building package.
Begin with an inventory and baseline
List every building, its floor area, primary use, operating hours, major equipment, control system, last replacement date and known comfort or maintenance problems. Separate offices and classrooms from residence halls, dining facilities, hospitals and research laboratories. Pull at least a year of utility data where available, normalize for weather and occupancy, and document the baseline before changing settings.
#1 Best Overall
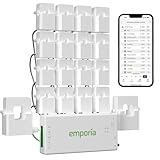
- SAFETY YOU CAN TRUST WITH UL CERTIFICATION: With Emporia Energy, your home energy monitoring is safe, reliable, and certified. The Emporia Vue is UL Listed, meaning it has met rigorous safety standards for electrical products in the U.S. and Canada. This certification ensures that every component has been thoroughly tested to prevent hazards, such as overheating, short-circuiting, or fire, offering you peace of mind as you manage your home’s energy consumption.
- INSTALLS IN CIRCUIT PANEL of most homes with clamp-on sensors. Supports Single phase, Single-split phase, and 2-wire systems. 3-wire systems; 3-phase, 4-wire Wye systems with earthed (TN or TT) neutral (no-Delta) are supported with an additional 200A sensor (sold separately).
- 24/7 ENERGY MANAGEMENT AND MONITORING: Automate, manage and control your home's real power anywhere, anytime to prevent costly repairs, conserve energy, and save costs. Monitor solar / net metering. PROTECTED BY A 1-YEAR WARRANTY.
- LOWER YOUR ELECTRIC BILL: Configure settings in the Emporia Energy App to automate energy management for time of use, peak demand, excess solar, and rewards programs. You can even see live reporting and invaluable savings opportunities instantly. Gauge real-time spending and get actionable notifications and automated energy management to help you reduce costs.
- REAL-TIME ENERGY DATA: REQUIRES 2.4 GHz WIFI WITH AN INTERNET CONNECTION to monitor energy use with iPhone / Android / Web app. Vue sensors collect energy data and are accurate from ±2%. The Vue is UL and CE Listed for your safety. 1 second data is only available in the app (when actively open) and retained 3 hours. Minute and hour data are retained in the cloud. 1 minute data is retained 7 days, 1 hour data is retained indefinitely. Export cloud data whenever you want in the app.
A baseline must identify what is being measured, for which building and over what period. Without that record, a later dollar or percentage claim can confuse weather, schedule changes or a change in building use with an efficiency improvement.
Bundle lighting, HVAC and controls
Evaluate LED conversion alongside fixture controls, occupancy sensors, daylight response, air-handling calibration, variable-speed drives, valve and damper operation, economizer settings, sequences of operation and building-envelope defects. The appropriate bundle depends on the building’s condition and use. A classroom may benefit from scheduling and daylight controls; a library may need humidity and ventilation attention; a residence hall may require domestic hot-water measures as well as space conditioning.
Recommended Free Tools
The U.S. Department of Energy’s 2019 account of the University of Virginia’s Clark Hall illustrates a combined approach. The university converted 5,000 interior and exterior fluorescent fixtures to LED, recalibrated air-handling units and upgraded HVAC controls. DOE reported $750,000 in annual energy savings, equal to 65% against that building’s pre-retrofit baseline. Those figures describe Clark Hall’s documented project, not a typical result that every campus should promise.
Design laboratory work around safety
Laboratories deserve a separate engineering review. DOE’s Smart Labs resource says a typical laboratory is three to four times as energy-intensive as an average commercial building and can account for up to 70% of a campus’s energy footprint. High air-change rates, fume hoods, pressure relationships, refrigeration and specialized equipment create large loads.
Rank #2

- 【Insightful Energy Tracking】Track your plug's energy use with clear and easy-to-understand statistics and intuitive charts, helping you optimize power usage.
- 【Estimate Your Energy Bill】 Enhance energy management by integrating with billing systems for clear cost visualization (both single and periodic readings). Additionally, programmable scheduling allows automatic operation of high-consumption devices during off-peak hours with lower electricity rates, resulting in cost savings.
- 【Smart Charging for Devices】Automatically cuts power once your device reaches the low-battery limit you set, preventing overcharging.
- 【Auto-Shutoff】Prevents electrical overload by automatically shutting off devices that use too much power.
- 【Voice & Remote Control】 With built-in support for both Alexa and Google Assistant, issue simple voice commands to adjust settings, turn devices on or off, or even access specific functions without lifting a finger. Manage Tapo P115 and its connected devices from anywhere with the user-friendly Tapo app.
Efficiency measures must preserve required ventilation, containment and emergency operation. DOE describes the University of California, Irvine Smart Labs approach as combining occupancy and air-quality sensors, variable-air-volume features and digital controls. Facilities engineers should design those changes with laboratory users and environmental health and safety staff; reducing airflow or overriding a safety interlock is not a generic savings measure.
Sequence the retrofit safely
- Survey: verify equipment nameplates, control points, schedules, sensor locations, lighting types and critical laboratory or clinical requirements.
- Model options: compare a lighting-only package, HVAC and controls package, and combined package using the same baseline and operating assumptions.
- Stage work: schedule shutdowns around teaching, research, patient-care and residence periods; provide temporary ventilation or cooling where required.
- Commission: test sensor calibration, valve and damper travel, alarms, occupancy modes, start-stop logic and safe fallback operation.
- Verify: track energy and comfort after commissioning and document any baseline adjustment.
Strategy 2: Manage operations, schedules and controls
Installed equipment saves energy only when it operates as intended. A control strategy should make the efficient state the normal state, reveal exceptions quickly and give facilities staff authority to correct them.
Match HVAC to actual use
Build schedules from room reservations, class timetables, laboratory protocols and residence patterns rather than from a single campus-wide assumption. Use start-stop optimization so systems reach conditions shortly before occupancy and relax set points after spaces are vacated. Keep critical spaces on their required operating mode, and document exceptions so an override does not become permanent.
Adopt a set-point and override policy
Define heating and cooling set-point bands by building type, seasonal conditions and health or research requirements. Require an owner, reason and expiration date for manual overrides. Review overrides weekly at first, then at a frequency that matches observed problems. A policy should also specify who can change schedules, how alarms are acknowledged and when a comfort complaint triggers an engineering investigation instead of a one-off adjustment.
Rank #3

- ⚡ EASY INSTALLATION: Installs in circuit panel of most homes with clamp-on sensors. Supports single-phase up to 240VAC line-neutral; single, split-phase 120/240VAC; and three-phase up to 415Y/240VAC (no Delta). The branch lines can automatically match different phases and have no restrictions in terms of quantity and voltage.Panels with access only to busbars will need flexible sensors available from SEM-Meter.
- ⚡ ENERGY MONITORING ANYTIME, ANYWHERE: Monitor your home's real power anywhere, anytime to prevent costly repairs, conserve energy, and save costs. Monitor solar / net metering. Light commercial 3 phase option available as a separate bundle. Protected by a 1-year warranty.
- ⚡ VARIOUS ELECTRICAL APPLIANCE MONITORING: Comes with 16 50A sensors to accurately monitor your air conditioner, furnace, water heater, washer, dryer, range, etc.
- ⚡ LOWER YOUR ELECTRIC BILL: SEM-Meter measures real-time spending and gets actionable notifications to understand where savings can be made, both to lower your electric bill and to conserve energy and protect the planet’s resources. Be an environmentalist.
- ⚡ REAL-TIME ENERGY DATA: Connect SEM-Meter device via 2.4GHz WiFi to monitor energy usage, with an accuracy range of 1%. View usage in real time through Android/Apple software. Statistics of power usage in now/day/week/month/year format: the validity period of hourly exported data is 90 days, and the exported data of day/month/year data is permanent, available at any time Export from application.
Audit space and equipment continuously
The DOE case describing Pace University’s coordinated energy management strategy includes ongoing building-space audits, matching HVAC equipment to occupancy, set-point policies, alerts for potentially wasteful equipment and monitoring through the building-management system. Apply the same loop: identify a mismatch, assign it to a person, correct it, and confirm that the correction persists.
- Compare commanded and actual occupancy schedules.
- Flag equipment running during unoccupied periods.
- Look for simultaneous heating and cooling, stuck dampers, implausible temperatures and sensors that disagree.
- Trend fan speeds, valve positions, supply-air temperatures and alarms rather than relying only on monthly utility totals.
- Review spaces whose energy use is out of proportion to their area or operating hours.
Use occupancy data carefully
Occupancy sensors, badge data, room reservations and air-quality sensors can improve scheduling, but each has uncertainty. A sensor may miss a quiet occupant; badge data may show entry without actual room use; a scheduled class may be canceled. Combine signals and set minimum ventilation and safe operating limits that cannot be bypassed by an occupancy algorithm.
Quick wins for a faster PC:
Clear out junk files and repair common Windows errorsFree Scan →Fix the driver behind crashes, sound loss and screen glitchesFind Drivers →Repair Windows errors before they cause bigger problemsFix Now →A 2010 Lawrence Berkeley National Laboratory university-campus study reported simulations estimating 5–15% lower building HVAC energy use when estimates of actual occupancy were used. The range is a simulation result, not measured savings for every campus. Use it to justify a pilot and measurement plan, not to create a guaranteed business case.
Keep laboratories in a protected control class
Laboratory control sequences should distinguish comfort zones from spaces with pressure, containment or air-change requirements. Integrate fume-hood status, air-quality readings and emergency modes with the building-management system, and test what happens when a sensor fails or communications drop. Facilities staff should be able to see whether a high-energy condition is required for safety or is simply an error.
Rank #4

- EM16P MODEL & LOCAL CONTROL & DATA PRIVACY: Access your home energy monitor data locally via Built-in Web UI, Open API, and MQTT without relying on cloud services. Unlike cloud-dependent monitors, Refoss ensures your data stays within your home network. Direct local access protects your privacy while giving you 100% full control of your home energy system.
- NATIVE HOME ASSISTANT & OPENCLAW AI: Experience seamless Native Home Assistant integration right out of the box—no firmware flashing or complex coding required. Featuring ✨NEW✨ OpenClaw Support, it enables AI-driven automation for smarter, real-time energy management and seamless smart home control.
- MAXIMIZE SOLAR & ZERO FEED-IN AUTOMATION: Designed for solar homes, the power monitor works with the Refoss app and Home Assistant to automatically use surplus solar power. Appliances like EV chargers, washing machines, and water heaters are powered during midday peaks, maximizing solar self-consumption and reducing low-value electricity feed-in to the grid. Optimizes usage and reduces bills.
- REAL-TIME MONITORING & ±1% ACCURACY: Monitor voltage, current, active power, and power factor of major appliances. Provides ±1% accuracy (200A: 2–200A; 60A: 1–60A) and ±2% at low current. Daily data stored up to 5 years and exportable. With no subscriptions or hidden fees, you get deep historical insights to help you identify every energy-saving opportunity and save 10–20% on monthly bills.
- SMART ALERTS & CIRCUIT-LEVEL CONTROL: Set usage targets for each individual circuit and receive instant alerts when appliances exceed normal consumption. Refoss app supports automation and peak management to optimize schedules, reduce peaks, and improve efficiency. Real-time electricity usage monitor for circuit-level insights.
Strategy 3: Plan campus-scale heating and cooling systems
When several buildings need plant replacement, compare building-by-building equipment with a shared thermal strategy. The analysis may include geothermal or other heat pumps, ambient-temperature loops, district heating and cooling, thermal storage, heat recovery and electrification. A central system is not automatically better; distribution losses, phasing, drilling conditions, demand diversity and operational complexity all matter.
Use a campus master plan, not a single-project estimate
Map simultaneous heating and cooling loads, future construction, utility capacity, available land, borefield or water resources, critical loads and planned plant retirement dates. Model seasonal and hourly operation, not only annual totals. Include distribution pipe or loop routes, electrical service upgrades, controls integration, maintenance staffing and how buildings will connect over time.
Learn from the Colorado Mesa case without extrapolating
DOE’s geothermal heat-pump case study for Colorado Mesa University describes a system that grew from an initial building connection to a campus system serving multiple buildings. The page reports a campus size of 1.2 million square feet and $15.9 million in savings since 2008. Both numbers are facts reported for that specific campus and do not establish a generally expected saving for another institution.
Add distributed resources where they solve a defined problem
A campus energy plan can coordinate building loads with photovoltaic generation, storage, electric vehicles, smart inverters and microgrid operation. DOE’s Clean Energy and Transactive Campus project describes research into that coordination. Treat these capabilities as planning and research avenues: their value depends on tariff structure, interconnection rules, equipment controls, resilience objectives and local economics.
Best Value
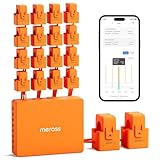
- SAFE & RELIABLE: Meross smart energy consumption monitor is ETL‑certified and compliant with the UL 61010 testing standard, ensuring safe and reliable home energy monitoring. Works with most US homes: single-phase 2-wire systems, single-split phase 3-wire systems, and 3-phase 4-wire Wye systems with earthed (TN or TT) neutral (no Delta). Easy clamp‑on design installs in minutes. Invert CT readings in the app—no physical flipping. PROTECTED BY 2-YEAR WARRANTY for worry-free use.
- TRACK ENERGY & CUT BILLS: Track power, voltage, current, and power factor within ±1% accuracy. Clear power usage and cost charts by minute/hour/day/month/year help you easily understand your energy use. Store up to 5 years of data and export hourly reports for deep analysis. Most users save 10–20% on energy costs by spotting energy hogs and getting accurate insights to cut their bills.
- 24/7 ENERGY MONITORING + SMART ALERTS: Real-time home energy monitoring from anywhere. Set custom alerts for unusual usage spikes and threshold breaches for total peace of mind. Catch issues early with no subscriptions, no cloud lock‑in, and no hidden fees — all built-in. Supports 2 main circuits (200A) + 16 branch circuits (60A), making it perfect for precise, circuit-level energy monitoring.
- MAXIMIZE YOUR SOLAR SAVINGS (HOME ASSISTANT): This solar energy monitor integrates with Home Assistant to detect solar surplus and automatically power EV chargers, water heaters, and other high‑use appliances. Stop wasting solar energy—use it yourself and cut your electricity bill faster. The perfect home energy monitor for solar homes.
- LOCAL DATA, FULL PRIVACY, NO SUBSCRIPTIONS: Connect seamlessly with Home Assistant for advanced energy automation. All energy data stays local—no cloud, no delays, no privacy concerns. Take full control of your home energy, reduce waste, and protect your privacy. Supports Open API and Web Control.
Define the service before selecting technology. Storage might reduce a demand charge, support backup power or absorb midday generation; those are different designs. A microgrid may support designated critical buildings during an outage, but it requires islanding controls, protection studies, fuel or charging plans and an operating authority.
Phase a shared system
- Screen loads: identify buildings with compatible temperature requirements and complementary heating and cooling demand.
- Check site constraints: assess geology, groundwater, drilling access, electrical capacity, easements and construction disruption.
- Compare scenarios: evaluate individual replacements, a shared loop, hybrid systems and a no-action baseline using lifecycle energy, emissions, maintenance and resilience criteria.
- Choose an anchor phase: connect buildings with predictable loads and clear metering, while sizing future tie-in capacity without overbuilding.
- Commission and expand: verify flow, temperatures, controls and metering before adding later buildings.
How should a campus choose among the strategies?
Use a site-specific audit and engineering assessment before claiming savings, payback or return on investment. The available higher-education examples do not provide a current apples-to-apples cost or payback comparison across campuses.
Free tools Windows power users keep installed
One-click scans. No signup required.
| Decision factor | Questions to answer |
|---|---|
| Building type and intensity | Is the load driven by classrooms, housing, food service, clinical care or laboratory ventilation? |
| Equipment condition | What is the remaining life, failure risk and control compatibility of current equipment? |
| Capital and lifecycle cost | What are design, construction, commissioning, energy, maintenance and replacement costs? |
| Energy and emissions goals | Which option reduces energy, peak demand, carbon or fuel use under the campus’s actual grid mix? |
| Utility and incentives | How do tariffs, demand charges, interconnection rules and available incentives change the result? |
| People and mission | Will work affect comfort, teaching, research, patient care or laboratory safety? |
| Measurement plan | What meters, weather data, occupancy records and baseline adjustments will verify performance? |
How to measure results and avoid common failures
Keep reported, expected and simulated outcomes separate
Label a documented project result, an engineering estimate and a simulation differently in board papers and public claims. Clark Hall’s 65% and $750,000 are reported results for one building. The 5–15% occupancy-control figure is simulated. A projected saving from a proposed retrofit remains a projection until measured against an agreed baseline.
Commission before declaring success
Common failures include uncalibrated sensors, schedules that revert after a software update, simultaneous heating and cooling, disabled alarms and equipment that is technically efficient but incorrectly sequenced. Commissioning should include trend review over representative occupied and unoccupied periods, operator training and a written list of unresolved issues with owners and dates.
Protect comfort, research and safety
Set complaint thresholds and escalation paths before changing set points. For laboratories and clinical spaces, involve environmental health and safety or clinical engineering in every sequence that affects pressure, airflow, temperature or emergency operation. A reduction that creates unsafe conditions is not an energy success.
Make the savings visible
Give facilities staff a dashboard that shows energy, demand, temperatures, alarms, occupancy signals and equipment status at useful time intervals. Review performance monthly with building owners, then investigate anomalies instead of averaging them away. Publish methods and baseline assumptions with any campus claim so future projects can be compared honestly.
Quick Recap
A practical first-year action plan
- Months 1–2: complete the building and equipment inventory, assemble utility data and identify high-intensity laboratories and buildings with obvious schedule problems.
- Months 3–4: commission or recalibrate priority sensors, correct schedules and overrides, and begin a pilot occupancy-aware control project in a noncritical building.
- Months 5–7: develop bundled retrofit designs for priority buildings, including lighting, air handling, HVAC controls and laboratory safeguards where applicable.
- Months 8–10: perform a campus thermal-system screen covering geothermal or other heat-pump options, distribution, electrical capacity, storage and resilience needs.
- Months 11–12: approve projects using the same baseline and measurement plan, publish expected versus verified results, and update the next-year capital sequence.
Product prices and availability are accurate as of the date/time indicated and are subject to change. Any price and availability information displayed on Amazon at the time of purchase will apply.

