What’s actually slowing this PC down?
Pick the symptom - the matching free tool is one click away.
Low solar output is not automatically a failed panel. The reliable way to diagnose it is to compare measured production with a weather- and season-adjusted expectation, then separate an environmental loss (clouds, shade, snow, dirt or heat), a monitoring problem, gradual aging and an equipment fault. Start with the production history, meter and inverter messages. Inspect surroundings from a safe location. Escalate persistent losses, damaged modules, repeated shutdowns and electrical alerts to the installer or a qualified solar technician rather than opening energized equipment.
First establish whether production is genuinely below expectation
A single cloudy day cannot prove a system is failing. Solar availability changes by location, season, storm track and cloud cover, while the panel nameplate describes rated capacity under test conditions rather than the energy a home will receive every day. The U.S. Department of Energy (DOE) advises tracking output over time and comparing actual generation with an appropriate expected-production estimate.
As an Amazon Associate I earn from qualifying purchases.
Use the right comparison
- Compare like with like: compare this month with the same month in prior years, not with a sunnier month or a neighbor’s array.
- Review several time scales: daily data reveals outages, monthly data shows seasonal patterns, and annual data is better for judging long-term change.
- Account for weather: note extended cloud, smoke, storms, snow and unusual heat during the period in question.
- Use the system’s own estimate: the original proposal, monitoring portal or an installer production model may include orientation, shading and local solar resource.
- Check what the model includes: modeled output may already allow for predictable losses. A raw app number and a generic online calculator are not necessarily comparable.
National Renewable Energy Laboratory (NREL) performance analysis, summarized by DOE, compares measured generation with modeled generation. The model can account for predictable losses, while effects such as soiling or inverter downtime may remain visible as a gap. That is why a system-specific, weather-aware baseline is more useful than a universal kilowatt-hour target.
Recommended Free Tools
Read the pattern before choosing a cause
| Observed pattern | What it suggests | What to verify |
|---|---|---|
| Lower output only during a cloudy, snowy or stormy period | Environmental variation is plausible | Compare irradiance, weather and the same season in another year |
| One or more strings or days suddenly fall to zero | Inverter availability, wiring, protection or communications issue | Production meter, inverter status and recorded alerts |
| Gradual decline over multiple years | Aging, increasing shade, soiling or a slow equipment change | Age-adjusted model, tree growth, surface condition and maintenance history |
| Monitoring app is blank but a meter still records generation | Communications outage rather than lost generation | Meter reading and inverter display, without opening equipment |
| Persistent underproduction in otherwise comparable weather | A system or design issue needs professional diagnosis | Installer review using measured data and the system model |
Environmental conditions that reduce solar energy
Clouds, season and severe weather
Solar modules need sunlight, so cloudier weeks and shorter seasonal solar windows reduce generation even when every component is operating. Snow can block light until it melts or slides away. Storms can also leave debris, damage modules or alter nearby shading. Record the weather alongside production rather than treating a weather-driven dip as a hardware diagnosis.
#1 Best Overall
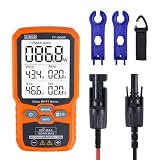
- ⚡ Professional-Grade PV Testing Measures maximum power (Pmax) up to 1000W, open-circuit voltage (Voc: 12-80V), and short-circuit current (Isc: 35A) with ±0.8% accuracy, ideal for validating solar panel performance in R&D, manufacturing, and field maintenance.
- ⚡ MPPT Efficiency Optimization Tracks Vmp (80V) & Amp (35A) in real-time to identify panel degradation or shading issues, helping installers maximize energy harvest and ROI for residential/commercial systems.
- ⚡ Industrial Safety & Durability Rated CAT III 1000V/CAT IV 600V with double-insulated probes, meeting IEC/EN 61010 standards for safe use on high-voltage PV arrays and combiner boxes.
- ⚡ Smart Data Management Features data hold + backlit LCD for reading values in dark environments (e.g., rooftops)
- ✅ Engineered for Solar Professionals Auto-ranging simplifies operation for technicians, while IP54 dust/water resistance and low-power auto-off ensure reliability in outdoor installations.
New or moving shade
Partial shading from a tree, new building, chimney, vent, satellite equipment or construction activity can reduce yield. The obstruction may affect only part of the array or only certain hours, making the annual loss less obvious. Look from ground level for new shadows at different times of day and seasons. Do not climb onto the roof to inspect a shadow line; use a qualified contractor if roof access is required.
Dirt, pollen, leaves and bird debris
Soiling blocks light. Pollen, dust, leaves and bird debris can be most significant when they cover a large area or remain in one location. DOE’s photovoltaic design guidance identifies soiling as a yield factor, but visible dirt alone does not prove it is the largest loss in your system. A shaded, failed or disconnected array will not be fixed by washing its surface.
Module operating temperature
Module temperature affects energy yield. A hot array can produce less than the same array under cooler conditions with comparable sunlight. Temperature effects are part of the reason an expected-output comparison should use a model that accounts for local conditions rather than a nameplate multiplied by hours of daylight.
How environmental causes differ from faults
Environmental losses generally track weather, season or time of day. A fault is more likely when output drops abruptly, a section of the system goes offline, an inverter reports an error or the loss persists during comparable sunny conditions. That distinction is a screening tool, not permission to work on electrical equipment.
Separate a monitoring problem from a generation problem
A portal that stopped updating can make a healthy system appear idle. Conversely, a portal may show stale or partial data while the array has a real production fault. Check independent indicators before assuming either explanation.
- Open the monitoring history. Look for the last successful update, missing intervals, a communications warning and whether the gap affects one inverter or the whole site.
- Check the production meter if one is installed. Determine whether it registers generation during daylight. Follow the meter manufacturer’s instructions; do not remove covers.
- Read the inverter’s normal user display or app. Record status text, fault codes, shutdown notices and the time they appeared. DOE guidance specifically recommends checking production meters and inverter faceplate messages.
- Compare indicators. A meter showing output while the portal is blank points toward communications. Both a meter and inverter showing no generation require an installer or qualified technician to investigate.
- Do not open energized equipment. Never probe DC wiring, bypass a protective device or repeatedly reset a ground-fault or other electrical alarm just to restore production.
Keep screenshots or photographs of alerts and a short log of dates, weather and readings. That record helps a technician distinguish an intermittent communications failure from a generation outage.
Rank #2

- ⚡ Professional-Grade PV Testing Measures maximum power (Pmax) up to 2000W, open-circuit voltage (Voc: 12-150V), and short-circuit current (Isc: 35A) with ±0.8% accuracy, ideal for validating solar panel performance in R&D, manufacturing, and field maintenance. shading issues, helping installers maximize energy harvest and ROI for residential/commercial systems.
- ⚡ MPPT Efficiency Optimization Tracks Vmp 150V) & Amp (35A) in real-time to identify panel degradation or
- ⚡ Industrial Safety & Durability Rated CAT III 1000V/CAT IV 600V with double-insulated probes, meeting IEC/EN 61010 standards for safe use on high-voltage PV arrays and combiner boxes.
- ⚡ Smart Data Management Features data hold + backlit LCD for reading values in dark environments (e.g., rooftops)
- ✅ Engineered for Solar Professionals Auto-ranging simplifies operation for technicians, while IP54 dust/water resistance and low-power auto-off ensure reliability in outdoor installations.
Equipment and design problems that need professional diagnosis
Module damage
Cracks, hot spots, delamination, impact marks or other visible damage can reduce output and create safety concerns. Damage may follow hail, falling branches, improper roof work or severe weather. View modules from the ground or another safe location. Do not touch a damaged module or its cables; document its location and contact the installer.
The Tool Desk
Outbyte PC Repair FREERepair Windows errors before they cause bigger problemsFix Now →Outbyte Driver Updater FREEFix the driver behind crashes, sound loss and screen glitchesFind Drivers →Inverter faults or shutdowns
The inverter converts array output for the building or grid. An error, repeated shutdown or unavailable inverter can remove production from an entire array or part of it. Record the exact message and time. A reset performed according to the owner’s manual may be permitted for a clearly documented, non-electrical user action, but repeated resets or a recurring fault require professional service. Do not remove covers.
Wiring, connectors and protection
DOE Federal Energy Management Program guidance lists wiring damage, module problems and inverter issues among photovoltaic failure modes. A loose or damaged connection, insulation fault or protective-device trip can cause intermittent or complete loss. Replacing a fuse or resetting ground-fault protection without finding the underlying cause does not repair the system and can expose you to energized conductors.
System design and expected operating profile
Array orientation, shading, inverter-to-array sizing and other design choices shape the generation curve. A design may intentionally limit output at certain times, and a monitoring graph can make that look surprising. The available evidence does not establish that a particular design feature explains any individual home’s shortfall. An installer must compare the as-built system, weather data and production model before labeling the behavior a design defect.
Understand gradual degradation without mislabeling a sudden drop
Photovoltaic performance normally changes gradually with age, but the rate varies by module, climate, installation and operating history. DOE’s Federal Energy Management Program presents about 0.5% degradation per year as an often-seen general reference. It is not a guarantee for a specific panel or whole system.
Do these 3 things before closing this tab:
1Clear out junk files and repair common Windows errors2Fix the driver behind crashes, sound loss and screen glitches3Repair Windows errors before they cause bigger problemsA separate DOE summary of the NREL PV Fleet initiative reports a median performance loss around 0.75% per year in a U.S. fleet analysis covering nearly 19,000 inverters. This is a fleet-level median, not a warranty threshold, a required annual loss rate or a forecast for your array.
Rank #3
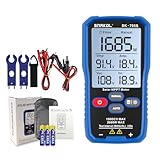
- MPPT Power Measurement: Designed for photovoltaic modules to accurately measure Pmax, Vmp, Imp, Voc and Isc, enabling fast and reliable performance checks during installation and maintenance.
- 2000W / 150V DC MAX: Supports up to 1000W output power, 80V DC maximum voltage and 0–45A current, suitable for most residential and commercial PV panels.
- AUTO & MANUAL Mode: Automatic mode for continuous measurements and manual mode for controlled single tests, ideal for commissioning, servicing and inspection tasks.
- 3.2" LCD Display With Backlight: Large 3.2-inch LCD screen with backlight and data hold function ensures clear readability when working outdoors.
- Portable & Ready To Use: Compact, lightweight tester with rear hanging slot. Includes test leads, alligator clips, storage pouch and user manual for immediate operation.
| Figure | How to interpret it | What it cannot tell you |
|---|---|---|
| About 0.5% per year | DOE FEMP’s general description of an often-seen module degradation rate | The exact loss of a particular module, array or year |
| Around 0.75% per year median | DOE’s summary of NREL PV Fleet results for nearly 19,000 inverters | A guarantee, warranty test or diagnosis of a home system |
Use an age-adjusted trend based on your own measured history. A sudden or intermittent decline should not be dismissed as degradation; first check weather, monitoring, inverter availability, wiring and module damage.
Should you clean the panels?
Clean only when visible soiling is plausibly affecting output and the work can be done without roof or electrical risk. Cleaning cannot correct shade, heat, inverter downtime, wiring faults, module damage or normal aging.
A safe decision process
- Confirm that dirt, pollen, leaves, bird debris or snow is present and that the timing matches the production decline.
- Read the module manufacturer’s maintenance instructions. Some warranties specify approved methods or prohibit certain chemicals and tools.
- Use ground-based observation whenever possible. Do not walk on modules or climb onto a roof without appropriate training, fall protection and electrical-safety controls.
- If access is difficult, the roof is wet or steep, or damage is visible, hire a qualified solar or roofing professional.
- If the manufacturer permits owner cleaning from a safe location, use only the stated method. A soft brush may remove loose surface material, but it is not a diagnostic solution and aggressive scrubbing can damage surfaces.
After any permitted cleaning, compare production over comparable sunny periods rather than expecting an immediate fixed increase. If the measured gap remains, investigate other causes.
Quick wins for a faster PC:
Clear out junk files and repair common Windows errorsFree Scan →Scan for outdated or missing drivers - takes under a minuteDriver Scan →A safe, end-to-end troubleshooting procedure
- Define the window. Write down when the lower output began and whether it affects one day, a month, a season or multiple years.
- Collect baseline data. Export or photograph daily, monthly and annual production, the original estimate and any available weather or solar-resource information.
- Check for obvious environmental changes. Note new shade, snow, debris, construction, tree growth and unusual heat without accessing unsafe roof areas.
- Verify data paths. Compare the monitoring portal with the production meter and inverter status to identify a communications-only problem.
- Record alerts exactly. Save inverter codes, shutdown times and screenshots; do not clear evidence by repeated resets.
- Inspect from a safe distance. Look for cracked glass, impact, scorching, loose-looking exterior conduit or other visible damage. Do not touch components.
- Check the age trend. Compare like seasons across years and judge the slope against an age-adjusted expectation, not a single day’s output.
- Contact the right professional. Ask the installer or a qualified solar technician for a model-versus-measured review when the loss persists, is abrupt, or coincides with an alert or damage.
- Provide useful evidence. Send the production history, weather notes, alert codes, photographs and dates of any roof, tree or construction changes.
How to make the comparison more precise
When a technician reviews the system, ask which interval and units are being compared. Kilowatt-hours over a month answer a different question from instantaneous kilowatts at noon. A short high-power reading can look normal even when the day’s energy total is low, while a daily total can hide a brief inverter shutdown. Keep the original system size, commissioning date, orientation, tilt and any documented shading assumptions with your records.
Ask whether the expected-production model uses local solar-resource and temperature information and whether it includes soiling, shading, electrical mismatch, wiring resistance, degradation and inverter availability. NREL’s performance method compares measured and modeled generation, but different models include different losses. A percentage shown by an app is therefore meaningful only when its denominator and assumptions are clear.
For a multi-inverter site, compare the affected unit with the others only after accounting for their different orientations or array sizes. A lower reading from one section is more informative when the sections are otherwise comparable. Do not infer a failed module from a single low point in a graph; request string-level testing from a qualified technician.
Rank #4

- Comprehensive Solar Panel Testing: UT673PV solar MPPT meter can effectively identify any abnormalities in solar panels by testing their maximum power, peak power voltage, peak power current, open circuit voltage, and short circuit current
- Wide Measurement Range: Maximum power test (Pmax) 5~800W, Peak power voltage (Vmp) 12~60V, Peak power current (Imp) 0~35A, Open circuit voltage (Voc) 12~60V, Short circuit current (Isc) 0~35A
- Multi-Language Support and Simultaneous Display: Featuring a spacious screen and automatic measurement capabilities, this device conveniently displays all measurement results simultaneously. Free switching of multiple languages ( EN, FR, DE, IT, ES, SV, PL, CZ )
- Portable and Self-Powered Design: Large screen and multiple result display. No batteries needed, powered by the solar panel. Equipped with MC4 test lead. Its portable design enables easy carrying, greatly enhancing the operational and maintenance efficiency for photovoltaic manufacturers, installers, and end users
- Complete Package Contents: What you get: 1 x UT673PV Solar MPPT Meter, 1 x paper Manual, 1 x Cloth Bag, 1 x MC4 wrench Tool, 1 x MC4 test lead with Safety Class CAT 0 60V rating
Questions to ask an installer or technician
- What baseline and weather period did you use, and is it comparable to the period when output fell?
- Does the monitoring gap represent missing communications or confirmed missing generation at the meter?
- Which loss categories are already included in the model?
- Do the alert history and shutdown times point to the inverter, wiring, protection or a communications device?
- Is the observed change gradual enough to fit an age trend, or does it require a fault investigation?
- What evidence would confirm that cleaning, shade or a damaged module is the dominant cause?
- What readings or photographs should be collected before the next service visit?
Written answers and a copy of the measured-versus-modeled comparison make it easier to evaluate warranty claims and to recognize whether a later change is new or part of the original condition.
When to stop troubleshooting and call a professional
Arrange qualified service when production remains below a suitable baseline after weather and monitoring issues are ruled out; when an inverter is faulted or repeatedly shuts down; when a meter and portal both show no generation; or when modules, connectors, conduit or wiring appear damaged. Electrical alerts, burning smells, arcing sounds, exposed conductors and storm damage should be treated as urgent hazards. Keep people away from the equipment and follow the system’s emergency instructions while waiting for service.
A qualified technician can test strings, inspect connectors and protection, evaluate inverter operation, assess module condition and rerun the production model. Those tasks require equipment and training that a homeowner’s visual check cannot replace.
What a good performance review should include
- Measured generation: interval, daily, monthly and annual records from the meter or monitoring system.
- Expected generation: the assumptions for location, orientation, tilt, shading, weather and temperature.
- Loss accounting: whether the model includes soiling, shading, wiring resistance, electrical mismatch, degradation and inverter availability.
- Event history: outages, alerts, maintenance, storms, roof work, tree growth and construction changes.
- A conclusion tied to evidence: environmental variation, communications failure, gradual trend or a confirmed equipment issue.
DOE’s PV Fleet resources describe these loss categories as a map of possible causes, not a diagnosis for any one home. The value of a review is the connection between your measured data and the assumptions used to predict it.
Frequently Asked Questions
Why are my solar panels producing less on a sunny day?
A sunny appearance does not guarantee the same solar resource as another day. Heat can reduce module yield, and partial shade, soiling, inverter availability or a communications error can also be involved. Compare the meter and inverter with a weather- and temperature-aware baseline before assuming a failed panel.
How can I tell whether the monitoring app is wrong?
Check the last successful update, communications warnings and missing intervals, then compare the app with the production meter and the inverter’s normal display. If the meter records generation while the portal is blank, the issue may be communications. If both show no output, arrange qualified service.
Best Value

- MPPT Power Measurement: Designed for photovoltaic modules to accurately measure Pmax, Vmp, Imp, Voc and Isc, enabling fast and reliable performance checks during installation and maintenance.
- 2200W / 150V DC MAX: Supports up to 1000W output power, 80V DC maximum voltage and 0–45A current, suitable for most residential and commercial PV panels.
- AUTO & MANUAL Mode: Automatic mode for continuous measurements and manual mode for controlled single tests, ideal for commissioning, servicing and inspection tasks.
- 3.2" LCD Display With Backlight: Large 3.2-inch LCD screen with backlight and data hold function ensures clear readability when working outdoors.
- Portable & Ready To Use: Compact, lightweight tester with rear hanging slot. Includes test leads, alligator clips, storage pouch and user manual for immediate operation.
How much output loss is normal as panels age?
DOE FEMP cites about 0.5% degradation per year as an often-seen general reference. A separate DOE summary of NREL’s analysis of nearly 19,000 inverters reports a median performance loss around 0.75% per year. Both are broad references, not guarantees or a diagnosis for one system.
Should I clean dirty solar panels myself?
Only when visible soiling plausibly matches the decline and the manufacturer’s instructions permit it. Use a safe, ground-based method where possible; never walk on modules or take an unsafe roof route. A soft brush may remove loose material, but cleaning will not fix shade, heat, inverter faults, wiring problems or degradation.
What should I do if the inverter shows an error code?
Record the exact code, time and weather, and save a screenshot or photograph. Follow only user actions clearly authorized in the owner’s manual. Do not remove covers, probe wiring, bypass protection or repeatedly reset a recurring fault; contact the installer or a qualified technician.
Can new tree growth cause a large production drop?
Yes. Partial shade can affect only part of an array or only certain hours, so it may appear as an unusual daily pattern rather than a complete outage. Look for new shadows from ground level at different times and seasons, and use a qualified contractor if roof access or vegetation work is required.
What information should I give the solar technician?
Provide daily, monthly and annual production history, the original estimate or model, weather notes, meter readings, inverter codes, monitoring screenshots, photographs taken from a safe distance and dates of storms, roof work, tree growth or construction. Also note whether the issue is abrupt, intermittent or gradual.
Can I diagnose a low-producing string by touching connectors or replacing a fuse?
No. Photovoltaic wiring can remain energized, and a fuse or ground-fault trip may indicate an underlying problem. DOE guidance cautions that replacing protection without finding the cause does not repair the system. Leave testing and repairs to qualified personnel.
The Bottom Line
Start with a fair, season- and weather-adjusted comparison, then cross-check the monitoring portal, production meter and inverter status. Inspect shade and soiling only from a safe location. Treat abrupt losses, repeated shutdowns, damaged components and electrical alerts as professional-service issues; gradual aging is a trend to measure, not an explanation for every sudden drop.
Free tools Windows power users keep installed
One-click scans. No signup required.
Quick Recap
Product prices and availability are accurate as of the date/time indicated and are subject to change. Any price and availability information displayed on Amazon at the time of purchase will apply.

