Sometimes, but not automatically. The Jevons paradox is the possibility that making energy use more efficient can increase total resource consumption. In homes, the usual mechanism is a rebound effect: when insulation, a new heating system or another upgrade lowers the effective cost of warmth, residents may heat more rooms, choose a higher temperature or run heating for longer. That extra service is called direct rebound, or “comfort taking” in UK policy work.
A rebound below 100% still leaves a net energy saving. Only when additional consumption exceeds the engineering saving—“backfire”—does total use rise above the no-upgrade counterfactual. Residential evidence shows meaningful and uneven heating rebound, but ordinary year-to-year consumption changes do not prove that efficiency caused an increase.
As an Amazon Associate I earn from qualifying purchases.
What the Jevons paradox means in a house
William Stanley Jevons’ idea is broader than a household heating bill. The OECD defines the paradox as a situation in which technological progress makes a resource more efficient to use but potentially increases the rate at which the resource is consumed. Energy-efficiency researchers often use “rebound effect” for the mechanisms that can offset expected savings.
For a home, start with the service the energy provides rather than with kilowatt-hours alone. The service might be a warm living room, hot water, lighting or cooling. An efficiency measure reduces the energy needed to deliver one unit of that service. If the effective price of the service falls, occupants may consume more of it, and saved money may be spent on other energy-using activities.
#1 Best Overall

- SAFETY YOU CAN TRUST WITH UL CERTIFICATION: With Emporia Energy, your home energy monitoring is safe, reliable, and certified. The Emporia Vue is UL Listed, meaning it has met rigorous safety standards for electrical products in the U.S. and Canada. This certification ensures that every component has been thoroughly tested to prevent hazards, such as overheating, short-circuiting, or fire, offering you peace of mind as you manage your home’s energy consumption.
- INSTALLS IN CIRCUIT PANEL of most homes with clamp-on sensors. Supports Single phase, Single-split phase, and 2-wire systems. 3-wire systems; 3-phase, 4-wire Wye systems with earthed (TN or TT) neutral (no-Delta) are supported with an additional 200A sensor (sold separately).
- 24/7 ENERGY MANAGEMENT AND MONITORING: Automate, manage and control your home's real power anywhere, anytime to prevent costly repairs, conserve energy, and save costs. Monitor solar / net metering. PROTECTED BY A 1-YEAR WARRANTY.
- LOWER YOUR ELECTRIC BILL: Configure settings in the Emporia Energy App to automate energy management for time of use, peak demand, excess solar, and rewards programs. You can even see live reporting and invaluable savings opportunities instantly. Gauge real-time spending and get actionable notifications and automated energy management to help you reduce costs.
- REAL-TIME ENERGY DATA: REQUIRES 2.4 GHz WIFI WITH AN INTERNET CONNECTION to monitor energy use with iPhone / Android / Web app. Vue sensors collect energy data and are accurate from ±2%. The Vue is UL and CE Listed for your safety. 1 second data is only available in the app (when actively open) and retained 3 hours. Minute and hour data are retained in the cloud. 1 minute data is retained 7 days, 1 hour data is retained indefinitely. Export cloud data whenever you want in the app.
Three levels of rebound
| Term | What increases | How to interpret the result |
|---|---|---|
| Direct rebound | The same service whose effective price fell—for example, more heating after insulation. | Some technical savings are offset, but net energy savings remain when rebound is below 100%. |
| Indirect rebound | Energy embodied in other goods and services purchased with bill savings. | The household’s wider energy footprint can be larger than the heating meter suggests. |
| Backfire | Total energy use rises above the relevant no-efficiency counterfactual. | This is the strongest claim and is not interchangeable with ordinary or partial rebound. |
Economy-wide rebound can also involve lower prices, higher productivity and growth. A direct household estimate and an economy-wide estimate therefore measure different boundaries and should not be compared as if they were the same statistic.
How heating creates a direct rebound
Heating makes the mechanism easy to see. Suppose a retrofit reduces the fuel needed to hold a room at a given temperature. A household that previously kept the thermostat low, heated only one room or tolerated cold spots may respond by using the improved comfort. It might heat additional rooms, extend the heating schedule or select a warmer set point. The UK government’s comfort-taking evidence review, published 11 March 2026, uses this kind of post-upgrade behaviour as a central example.
That response is not necessarily waste. People who were under-heating may gain health, comfort and usable living space. A warmer, drier home can be a welfare improvement even when the meter records less of the expected technical saving. Evaluating a project only by its engineering model can therefore miss a legitimate benefit.
Do these 3 things before closing this tab:
1Clear out junk files and repair common Windows errors2Scan for outdated or missing drivers - takes under a minute3Repair Windows errors before they cause bigger problemsWhy the counterfactual matters
Rebound is a comparison, not a simple before-and-after reading. Analysts estimate how much energy the home would have used without the efficiency improvement, then compare actual post-upgrade use with that baseline. Weather, energy prices, occupancy, appliance ownership and building condition can move consumption in either period. A small rise after a retrofit is not, by itself, proof of backfire.
What the residential evidence shows
Dutch heating study: a large but specific estimate
Aydin, Kok and Brounen’s 2017 paper in the RAND Journal of Economics analysed residential heating in 563,000 Dutch households. Using instrumental-variable and fixed-effects methods, and checking the result with a quasi-experimental retrofit-subsidy analysis, it estimated a heating rebound of 26.7% for homeowners and 41.3% for tenants.
Those percentages are the study’s estimates for its Dutch sample and methods, not universal constants for every country, building or measure. The paper also found variation by wealth, income and actual energy-use intensity. Tenure, baseline consumption and household resources can therefore change the response to the same technical upgrade.
Rank #2

- ⚡ EASY INSTALLATION: Installs in circuit panel of most homes with clamp-on sensors. Supports single-phase up to 240VAC line-neutral; single, split-phase 120/240VAC; and three-phase up to 415Y/240VAC (no Delta). The branch lines can automatically match different phases and have no restrictions in terms of quantity and voltage.Panels with access only to busbars will need flexible sensors available from SEM-Meter.
- ⚡ ENERGY MONITORING ANYTIME, ANYWHERE: Monitor your home's real power anywhere, anytime to prevent costly repairs, conserve energy, and save costs. Monitor solar / net metering. Light commercial 3 phase option available as a separate bundle. Protected by a 1-year warranty.
- ⚡ VARIOUS ELECTRICAL APPLIANCE MONITORING: Comes with 16 50A sensors to accurately monitor your air conditioner, furnace, water heater, washer, dryer, range, etc.
- ⚡ LOWER YOUR ELECTRIC BILL: SEM-Meter measures real-time spending and gets actionable notifications to understand where savings can be made, both to lower your electric bill and to conserve energy and protect the planet’s resources. Be an environmentalist.
- ⚡ REAL-TIME ENERGY DATA: Connect SEM-Meter device via 2.4GHz WiFi to monitor energy usage, with an accuracy range of 1%. View usage in real time through Android/Apple software. Statistics of power usage in now/day/week/month/year format: the validity period of hourly exported data is 90 days, and the exported data of day/month/year data is permanent, available at any time Export from application.
UK consumption trends: context, not causal proof
The UK Department for Energy Security and Net Zero’s 2026 NEED summary reports median domestic consumption through 2024. Between 2022 and 2024, median gas use rose 3% in England and Wales and 2% in Scotland. Electricity was unchanged in England and Wales and fell 2% in Scotland.
The same summary reports that 2024 use remained below 2021: gas was 13% lower and electricity 9% lower in England and Wales; in Scotland, gas was 13% lower and electricity 12% lower. These movements followed record falls from 2021 to 2022. They include the effects of weather, prices, household composition and other changes, so they cannot isolate an efficiency-driven rebound or establish Jevons backfire.
What the US survey can—and cannot—tell you
The U.S. Energy Information Administration’s Residential Energy Consumption Survey (RECS) is a nationally representative survey of energy characteristics, usage patterns, costs and household demographics. Its 2024 household survey collected responses from nearly 17,000 households across all 50 states and Washington, D.C. The housing-characteristics release references an estimated universe of 132.5 million occupied primary-residence homes.
The cited 2024 material is preliminary. It can describe housing and energy-use patterns, but a survey release alone does not estimate a causal rebound rate. Check the release status before treating a preliminary figure as a final national estimate.
Why rebound varies between homes
Construction decisions meet households with very different starting points. A well-funded owner who already heats every room has less unused comfort to reclaim than a low-income tenant who keeps rooms cold to control bills. The same insulation package can therefore produce different meter outcomes and different welfare outcomes.
Free tools Windows power users keep installed
One-click scans. No signup required.
- Baseline comfort: occupants who were under-heating have more scope for comfort taking.
- Income and wealth: resources affect whether savings are spent on additional heat, other energy-using goods or non-energy needs.
- Tenure and control: owners and tenants may differ in retrofit decisions, heating controls and incentives.
- Energy-use intensity: high-use and low-use homes can respond differently to an efficiency gain.
- Building and system constraints: insulation, ventilation, emitters, controls and occupancy determine what extra service is practical.
- Prices and weather: a cold season or a price change can obscure the behavioural response to an upgrade.
These factors are why a single “rebound percentage” should not be applied to a project without checking its population, end use, time period and counterfactual.
Rank #3

- EM16P MODEL & LOCAL CONTROL & DATA PRIVACY: Access your home energy monitor data locally via Built-in Web UI, Open API, and MQTT without relying on cloud services. Unlike cloud-dependent monitors, Refoss ensures your data stays within your home network. Direct local access protects your privacy while giving you 100% full control of your home energy system.
- NATIVE HOME ASSISTANT & OPENCLAW AI: Experience seamless Native Home Assistant integration right out of the box—no firmware flashing or complex coding required. Featuring ✨NEW✨ OpenClaw Support, it enables AI-driven automation for smarter, real-time energy management and seamless smart home control.
- MAXIMIZE SOLAR & ZERO FEED-IN AUTOMATION: Designed for solar homes, the power monitor works with the Refoss app and Home Assistant to automatically use surplus solar power. Appliances like EV chargers, washing machines, and water heaters are powered during midday peaks, maximizing solar self-consumption and reducing low-value electricity feed-in to the grid. Optimizes usage and reduces bills.
- REAL-TIME MONITORING & ±1% ACCURACY: Monitor voltage, current, active power, and power factor of major appliances. Provides ±1% accuracy (200A: 2–200A; 60A: 1–60A) and ±2% at low current. Daily data stored up to 5 years and exportable. With no subscriptions or hidden fees, you get deep historical insights to help you identify every energy-saving opportunity and save 10–20% on monthly bills.
- SMART ALERTS & CIRCUIT-LEVEL CONTROL: Set usage targets for each individual circuit and receive instant alerts when appliances exceed normal consumption. Refoss app supports automation and peak management to optimize schedules, reduce peaks, and improve efficiency. Real-time electricity usage monitor for circuit-level insights.
How to assess rebound in a residential retrofit
Builders, designers and homeowners can use a structured assessment before claiming that an upgrade will deliver a particular saving.
- Define the service. State whether the objective is indoor temperature, heated floor area, hot-water availability, cooling or another service. Do not treat all household energy as one undifferentiated output.
- Record the baseline. Gather at least a year of bills or meter data where available, plus floor area, occupancy, heating schedule, set points and known property changes. Note the weather period represented by the bills.
- Specify the technical counterfactual. Estimate consumption with the proposed measure but with the same service level as before. This is the engineering saving against which rebound is calculated.
- Ask occupants what will change. Discuss rooms currently left cold, preferred temperatures, working-from-home patterns and hot-water use. A comfort plan makes an assumed behaviour change visible instead of hiding it in a model.
- Separate direct and indirect effects. A warmer home is a direct heating response. Spending the bill saving on a more energy-intensive purchase is indirect and requires a wider boundary.
- Measure after completion. Compare post-upgrade consumption with a weather-adjusted, occupancy-adjusted baseline where possible. Keep the measurement period and assumptions with the result.
- Report welfare as well as energy. Record temperature, humidity, usable rooms, affordability and complaints alongside kilowatt-hours. A smaller-than-modelled saving can coexist with a better and healthier home.
A practical monitoring checklist
- Meter readings or smart-meter intervals before and after the work.
- Outdoor temperature or an accepted degree-day adjustment.
- Heating set points, schedules and the number of heated rooms.
- Occupancy changes, home working and major appliance additions.
- Fuel prices and billing-period changes.
- Ventilation operation and indoor humidity where moisture risk is relevant.
Design and construction choices that keep expectations realistic
Efficiency measures should be designed for the building and the people using it, not sold with a universal saving promise. Insulation, draught control, glazing, heating-system efficiency and controls interact. A fabric upgrade can alter surface temperatures and heating demand; ventilation still has to provide adequate air quality and manage moisture.
Set out two outcomes in the specification: the technical reduction under stated assumptions and the service level occupants are expected to enjoy. If a client intends to heat more rooms after the work, that is a planned comfort outcome, not an unexplained “failure” of the retrofit. Conversely, a schedule or control strategy can help a household avoid heating empty rooms without claiming that a thermostat eliminates rebound.
What’s actually slowing this PC down?
Pick the symptom - the matching free tool is one click away.
Using a programmable thermostat
A programmable home thermostat can be offered as an optional control for compatible systems, with schedules matched to occupancy. The available evidence does not establish that a thermostat prevents rebound or delivers a quantified saving for every heating system. Verify compatibility, zoning, user understanding and current product details before specifying one. Controls are most useful when residents can override them easily and understand what each setting does.
Common mistakes when interpreting household energy data
Calling every rebound “backfire”
If a model predicts 1,000 units of savings and behaviour offsets 267 units, the result is still a 733-unit net saving. The 26.7% figure from the Dutch homeowner estimate illustrates the category: it is a partial rebound, not evidence that total use increased above the no-upgrade case.
Reading a national trend as an experiment
UK median gas use rising after an unusually large fall does not identify which homes upgraded, how their comfort changed or what would have happened without the upgrades. National statistics are valuable context, but causal claims require a design that addresses weather, prices, household changes and selection into retrofit.
Rank #4
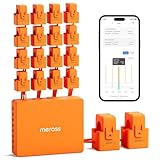
- SAFE & RELIABLE: Meross smart energy consumption monitor is ETL‑certified and compliant with the UL 61010 testing standard, ensuring safe and reliable home energy monitoring. Works with most US homes: single-phase 2-wire systems, single-split phase 3-wire systems, and 3-phase 4-wire Wye systems with earthed (TN or TT) neutral (no Delta). Easy clamp‑on design installs in minutes. Invert CT readings in the app—no physical flipping. PROTECTED BY 2-YEAR WARRANTY for worry-free use.
- TRACK ENERGY & CUT BILLS: Track power, voltage, current, and power factor within ±1% accuracy. Clear power usage and cost charts by minute/hour/day/month/year help you easily understand your energy use. Store up to 5 years of data and export hourly reports for deep analysis. Most users save 10–20% on energy costs by spotting energy hogs and getting accurate insights to cut their bills.
- 24/7 ENERGY MONITORING + SMART ALERTS: Real-time home energy monitoring from anywhere. Set custom alerts for unusual usage spikes and threshold breaches for total peace of mind. Catch issues early with no subscriptions, no cloud lock‑in, and no hidden fees — all built-in. Supports 2 main circuits (200A) + 16 branch circuits (60A), making it perfect for precise, circuit-level energy monitoring.
- MAXIMIZE YOUR SOLAR SAVINGS (HOME ASSISTANT): This solar energy monitor integrates with Home Assistant to detect solar surplus and automatically power EV chargers, water heaters, and other high‑use appliances. Stop wasting solar energy—use it yourself and cut your electricity bill faster. The perfect home energy monitor for solar homes.
- LOCAL DATA, FULL PRIVACY, NO SUBSCRIPTIONS: Connect seamlessly with Home Assistant for advanced energy automation. All energy data stays local—no cloud, no delays, no privacy concerns. Take full control of your home energy, reduce waste, and protect your privacy. Supports Open API and Web Control.
Mixing boundaries
Do not place a direct heating estimate beside an economy-wide rebound estimate and imply they are equivalent. State whether the result covers one end use, all household energy, spending-related energy or wider resource consumption.
The Tool Desk
Outbyte Driver Updater FREEFix the driver behind crashes, sound loss and screen glitchesFind Drivers →Outbyte PC Repair FREEClear out junk files and repair common Windows errorsFree Scan →Ignoring distribution
Averages conceal who gained comfort and who saw little change. Report tenure, income, wealth and baseline intensity when the evidence provides them, and consider affordability and health rather than treating every additional degree of warmth as an environmental loss.
Independent reader supportYour contribution helps us test, update, and keep practical guides available for everyone.What this means for homeowners and contractors
For a homeowner, efficiency remains a rational way to reduce the energy needed for a chosen comfort level, improve thermal conditions and make bills less exposed to prices. Budget for the possibility that the household will use some of the gain as additional warmth. Track actual performance rather than assuming the design estimate is a guaranteed bill reduction.
For a contractor or designer, write assumptions into the scope: target temperatures, heated rooms, occupancy, ventilation, controls and the weather basis of any calculation. Explain that savings are measured against a counterfactual and that occupant comfort may change after the work. Avoid promising a fixed percentage unless the property-specific evidence supports it.
For policymakers and evaluators, pair meter outcomes with indoor conditions and affordability. A project that delivers fewer kilowatt-hours than its engineering model but removes chronic under-heating may be successful on welfare grounds while still requiring an honest account of the residual rebound.
Windows Errors? Fix Them Before They Spread
Repair common Windows errors and clear accumulated junk for a smoother, more stable PC - no reinstall needed.Free scan · no reinstallCrashes, No Sound, or Screen Glitches?
Random freezes, missing sound and display glitches usually trace back to one bad driver. Find and replace yours safely.Free scan · under a minuteBottom line
Residential efficiency can trigger more energy service, especially more heating, but the evidence does not justify saying that every upgrade raises total consumption. Rebound is a spectrum: direct comfort taking and indirect spending can reduce expected savings; only rebound above 100% is backfire. The strongest available household estimate here—26.7% for Dutch homeowners and 41.3% for Dutch tenants—belongs to a specific 2017 study, while recent UK and US figures provide context rather than proof of causation. The sound construction approach is to model a clear baseline, design for real comfort, measure after completion and report both energy and welfare.
Best Value
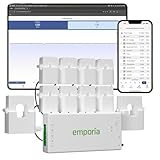
- SAFETY YOU CAN TRUST WITH UL CERTIFICATION: With Emporia Energy, your home energy monitoring is safe, reliable, and certified. The Emporia Vue is UL Listed, meaning it has met rigorous safety standards for electrical products in the U.S. and Canada. This certification ensures that every component has been thoroughly tested to prevent hazards, such as overheating, short-circuiting, or fire, offering you peace of mind as you manage your home’s energy consumption.
- INSTALLS IN CIRCUIT PANEL of most homes with clamp-on sensors. Supports Single phase, Single-split phase, and 2-wire systems. 3-wire systems; 3-phase, 4-wire Wye systems with earthed (TN or TT) neutral (no-Delta) are supported with an additional 200A sensor (sold separately).
- 24/7 ENERGY MANAGEMENT AND MONITORING: Automate, manage and control your home's real power anywhere, anytime to prevent costly repairs, conserve energy, and save costs. Monitor solar / net metering. PROTECTED BY A 1-YEAR WARRANTY.
- LOWER YOUR ELECTRIC BILL: Configure settings in the Emporia Energy App to automate energy management for time of use, peak demand, excess solar, and rewards programs. You can even see live reporting and invaluable savings opportunities instantly. Gauge real-time spending and get actionable notifications and automated energy management to help you reduce costs.
- REAL-TIME ENERGY DATA: REQUIRES 2.4 GHz WIFI WITH AN INTERNET CONNECTION to monitor energy use with iPhone / Android / Web app. Vue sensors collect energy data and are accurate from ±2%. The Vue is UL and CE Listed for your safety. 1 second data is only available in the app (when actively open) and retained 3 hours. Minute and hour data are retained in the cloud. 1 minute data is retained 7 days, 1 hour data is retained indefinitely. Export cloud data whenever you want in the app.
Frequently Asked Questions
Is the Jevons paradox the same as the rebound effect?
They overlap, but the terms are not identical in strength. Rebound describes mechanisms that offset expected efficiency savings; the Jevons paradox is the possibility that resource consumption rises overall. Backfire is the above-100% case.
Does insulating a house always increase its energy use?
No. Insulation reduces the energy required for a given indoor condition. Occupants may choose more warmth, but that response can be partial, absent or—rarely—large enough to exceed the technical saving.
Can UK gas statistics prove rebound?
No. The 2026 NEED figures describe national median trends. Weather, prices, occupancy and other factors prevent those observations from isolating an efficiency-driven causal effect.
Why might tenants show more heating rebound than homeowners?
The 2017 Dutch study estimated different rates—41.3% for tenants versus 26.7% for homeowners—and found heterogeneity by wealth, income and energy-use intensity. Those results describe that study’s population, not a universal rule.
Should a retrofit appraisal count improved comfort as a benefit?
Yes. If occupants previously under-heated the home, using part of the technical saving for a healthier or more comfortable temperature is a welfare gain. Report it separately from the meter saving.
Quick Recap
Product prices and availability are accurate as of the date/time indicated and are subject to change. Any price and availability information displayed on Amazon at the time of purchase will apply.

