Designers seeking cleaner energy should start by using less energy, then electrify suitable building services and supply the remaining demand with clean energy available on-site, nearby, through efficient district systems or from a cleaner grid. This order matters: a smaller, more efficient load needs less equipment and generation, while a whole-life assessment prevents operational savings from being offset by high-carbon materials and construction.
What “cleaner energy” means in building design
Cleaner-energy design is not a single technology choice. It is a coordinated way to reduce demand, choose efficient systems, replace fossil-fuel equipment where practical and account for emissions over the building’s life.
As an Amazon Associate I earn from qualifying purchases.
The European Commission describes a zero-emission building as one with no on-site fossil-fuel emissions, very low energy needs achieved through insulation, smart design and efficient systems, and clean energy supplied from on-site or nearby sources or through clean-energy grids. That definition makes building performance the starting point rather than treating solar panels or another supply technology as a substitute for poor efficiency.
“Clean” also depends on boundaries. A building may have low operating emissions while its structure, finishes and equipment carry substantial emissions from manufacturing, transport, replacement and disposal. Designers therefore need both an operational-energy plan and a whole-life carbon plan.
#1 Best Overall

- SAFETY YOU CAN TRUST WITH UL CERTIFICATION: With Emporia Energy, your home energy monitoring is safe, reliable, and certified. The Emporia Vue is UL Listed, meaning it has met rigorous safety standards for electrical products in the U.S. and Canada. This certification ensures that every component has been thoroughly tested to prevent hazards, such as overheating, short-circuiting, or fire, offering you peace of mind as you manage your home’s energy consumption.
- INSTALLS IN CIRCUIT PANEL of most homes with clamp-on sensors. Supports Single phase, Single-split phase, and 2-wire systems. 3-wire systems; 3-phase, 4-wire Wye systems with earthed (TN or TT) neutral (no-Delta) are supported with an additional 200A sensor (sold separately).
- 24/7 ENERGY MANAGEMENT AND MONITORING: Automate, manage and control your home's real power anywhere, anytime to prevent costly repairs, conserve energy, and save costs. Monitor solar / net metering. PROTECTED BY A 1-YEAR WARRANTY.
- LOWER YOUR ELECTRIC BILL: Configure settings in the Emporia Energy App to automate energy management for time of use, peak demand, excess solar, and rewards programs. You can even see live reporting and invaluable savings opportunities instantly. Gauge real-time spending and get actionable notifications and automated energy management to help you reduce costs.
- REAL-TIME ENERGY DATA: REQUIRES 2.4 GHz WIFI WITH AN INTERNET CONNECTION to monitor energy use with iPhone / Android / Web app. Vue sensors collect energy data and are accurate from ±2%. The Vue is UL and CE Listed for your safety. 1 second data is only available in the app (when actively open) and retained 3 hours. Minute and hour data are retained in the cloud. 1 minute data is retained 7 days, 1 hour data is retained indefinitely. Export cloud data whenever you want in the app.
The design sequence that usually produces the best result
1. Reduce loads with passive design
Orientation, window placement, insulation, airtightness, shading and daylighting influence how much heating, cooling and lighting the building needs. A well-designed envelope can reduce peak loads as well as annual consumption, allowing smaller mechanical systems and less energy infrastructure.
Climate and site conditions determine the right balance. Solar exposure that helps winter heating may increase summer cooling loads; external shading, glazing selection and thermal mass must be considered together. The useful question is not whether a feature is inherently sustainable, but whether it lowers the project’s loads in its actual climate and operating pattern.
2. Specify efficient systems and controls
After passive measures, designers can select efficient lighting, ventilation, hot-water, heating and cooling equipment sized for the reduced loads. Smart controls, zoning, sensors and commissioning help systems operate only when and where needed. Controls cannot rescue an inefficient envelope, but they can prevent avoidable runtime and improve how the building responds to occupancy and weather.
Recommended Free Tools
Rank #2
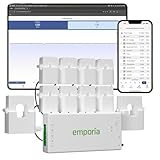
- SAFETY YOU CAN TRUST WITH UL CERTIFICATION: With Emporia Energy, your home energy monitoring is safe, reliable, and certified. The Emporia Vue is UL Listed, meaning it has met rigorous safety standards for electrical products in the U.S. and Canada. This certification ensures that every component has been thoroughly tested to prevent hazards, such as overheating, short-circuiting, or fire, offering you peace of mind as you manage your home’s energy consumption.
- INSTALLS IN CIRCUIT PANEL of most homes with clamp-on sensors. Supports Single phase, Single-split phase, and 2-wire systems. 3-wire systems; 3-phase, 4-wire Wye systems with earthed (TN or TT) neutral (no-Delta) are supported with an additional 200A sensor (sold separately).
- 24/7 ENERGY MANAGEMENT AND MONITORING: Automate, manage and control your home's real power anywhere, anytime to prevent costly repairs, conserve energy, and save costs. Monitor solar / net metering. PROTECTED BY A 1-YEAR WARRANTY.
- LOWER YOUR ELECTRIC BILL: Configure settings in the Emporia Energy App to automate energy management for time of use, peak demand, excess solar, and rewards programs. You can even see live reporting and invaluable savings opportunities instantly. Gauge real-time spending and get actionable notifications and automated energy management to help you reduce costs.
- REAL-TIME ENERGY DATA: REQUIRES 2.4 GHz WIFI WITH AN INTERNET CONNECTION to monitor energy use with iPhone / Android / Web app. Vue sensors collect energy data and are accurate from ±2%. The Vue is UL and CE Listed for your safety. 1 second data is only available in the app (when actively open) and retained 3 hours. Minute and hour data are retained in the cloud. 1 minute data is retained 7 days, 1 hour data is retained indefinitely. Export cloud data whenever you want in the app.
3. Pair efficiency with electrification
AIA’s Design for Energy framework says, “Pair efficiency with electrification to ensure low operational costs.” Electrification can reduce emissions when electricity is generated from cleaner resources such as wind and solar. Ground-source and air-source heat pumps are examples of electrified systems identified in the framework; the European Commission also identifies ambient heat used by heat pumps as a clean-energy source.
Electrification is not automatically low-carbon everywhere. Designers should check the local grid mix, seasonal demand, available electrical capacity, refrigerant and equipment requirements, and whether a heat pump can meet the building’s temperature and hot-water needs. In some projects, backup or supplemental systems may still be needed, subject to local rules and the project’s emissions goals.
4. Meet the remaining demand with clean supply
Only after demand reduction and efficient electrification should the design determine how to supply the remaining energy. AIA explicitly advises: “Prioritize passive design strategies and energy efficiency before adding on-site renewables or considering RECs.” On-site generation can be valuable, but adding panels to compensate for excessive loads generally requires more area, equipment and capital than reducing those loads first.
Rank #3

- ⚡ EASY INSTALLATION: Installs in circuit panel of most homes with clamp-on sensors. Supports single-phase up to 240VAC line-neutral; single, split-phase 120/240VAC; and three-phase up to 415Y/240VAC (no Delta). The branch lines can automatically match different phases and have no restrictions in terms of quantity and voltage.Panels with access only to busbars will need flexible sensors available from SEM-Meter.
- ⚡ ENERGY MONITORING ANYTIME, ANYWHERE: Monitor your home's real power anywhere, anytime to prevent costly repairs, conserve energy, and save costs. Monitor solar / net metering. Light commercial 3 phase option available as a separate bundle. Protected by a 1-year warranty.
- ⚡ VARIOUS ELECTRICAL APPLIANCE MONITORING: Comes with 16 50A sensors to accurately monitor your air conditioner, furnace, water heater, washer, dryer, range, etc.
- ⚡ LOWER YOUR ELECTRIC BILL: SEM-Meter measures real-time spending and gets actionable notifications to understand where savings can be made, both to lower your electric bill and to conserve energy and protect the planet’s resources. Be an environmentalist.
- ⚡ REAL-TIME ENERGY DATA: Connect SEM-Meter device via 2.4GHz WiFi to monitor energy usage, with an accuracy range of 1%. View usage in real time through Android/Apple software. Statistics of power usage in now/day/week/month/year format: the validity period of hourly exported data is 90 days, and the exported data of day/month/year data is permanent, available at any time Export from application.
Clean-energy pathways and when they fit
| Pathway | Where energy is supplied | What it can do | Key questions before selection |
|---|---|---|---|
| Passive design and efficiency | Reduces energy needed by the building | Lower heating, cooling, lighting and ventilation loads; smaller systems | Does the envelope respond to the local climate, orientation, occupancy and operating schedule? |
| Air-source or ground-source heat pumps | Electric equipment using ambient or ground heat | Electrifies heating and, in some configurations, cooling and hot water | Are temperatures, peak loads, space, noise, electrical service and maintenance requirements compatible? |
| Photovoltaic panels | On-site electricity | Generates electricity where roof, façade or site conditions permit | Is there adequate solar exposure, structural capacity, area, access and a workable connection arrangement? |
| Solar thermal panels | On-site heat | Can contribute to hot-water or other thermal loads | Do the building’s hot-water profile, storage needs and solar resource justify the system? |
| Renewable-energy communities | Nearby or shared generation | Allows projects to participate in collective renewable supply where available | What local rules, governance, connection terms and geographic boundaries apply? |
| Efficient district heating and cooling | District or network supply | Provides shared thermal energy without every building having an individual plant | Is a suitable network available, and are its efficiency, energy sources, connection costs and future plans documented? |
| Cleaner grid electricity | Grid-delivered energy | Supplies electrified systems without on-site generation | What is the current and expected grid mix, capacity, tariff structure and reliability? |
No source establishes one universally best technology or a universal cost ranking. Availability, performance and emissions depend on location, building type, loads, budget, grid conditions and applicable codes.
Do these 3 things before closing this tab:
1Scan for outdated or missing drivers - takes under a minute2Repair Windows errors before they cause bigger problems3Fix the driver behind crashes, sound loss and screen glitchesHow to evaluate a project step by step
- Define the brief and boundary conditions. Record location, climate, building use, floor area, occupancy, operating hours, target comfort, renovation constraints, budget and applicable planning and energy rules. Separate a new-build decision from a retrofit decision because the feasible envelope and services options may differ.
- Model the baseline. Estimate heating, cooling, hot-water, lighting, ventilation and plug loads using the intended schedule. Identify peak electrical and thermal loads, not only annual totals; infrastructure and equipment are sized for peaks.
- Test passive alternatives first. Compare orientation, massing, glazing, insulation, airtightness, shading, daylight and natural-ventilation strategies. Keep the options that reduce loads without creating unacceptable overheating, glare, moisture or indoor-air-quality risks.
- Choose efficient systems for the reduced loads. Size heating, cooling, ventilation and hot-water equipment from the revised loads. Include controls, zoning, commissioning and maintenance access in the design rather than treating them as post-construction additions.
- Assess electrification. Check whether heat pumps or other electric equipment can meet required temperatures and capacity. Confirm electrical service, plant space, noise limits, cold-weather or high-temperature performance, hot-water storage and any need for supplementary capacity.
- Map clean-energy supply. Evaluate roof and site solar potential, solar thermal demand, nearby shared generation, district networks and the electricity grid. Document whether the source is on-site, nearby, district-based or grid-delivered, and how its availability could change.
- Run a whole-life carbon assessment. Include operational energy and emissions from construction products and their production and transport, building use and product replacement, demolition and waste management. Compare material quantities, service lives and replacement cycles alongside energy scenarios.
- Check compliance and delivery risk. Verify current local codes, connection requirements, planning constraints, fire and safety provisions, procurement lead times, commissioning responsibilities and measurement plans. A concept that cannot be permitted, connected or maintained is not a usable low-carbon design.
- Set performance evidence requirements. Define what will be metered, who will verify it, how controls will be tuned after occupation and how deviations will be corrected. Predicted performance is a design input, not proof of actual operation.
Operational emissions and embodied carbon must be designed together
Life-cycle global warming potential combines emissions from energy used during operation with emissions associated with construction products and life-cycle activities. The relevant stages include production and transport of products, building use, replacement of products and systems, and demolition and waste management.
Reducing operational energy can justify efficient equipment and smaller plant, but replacement schedules matter. A system with lower use-phase emissions may require more material or earlier replacement. Conversely, retaining an existing structure in a retrofit can avoid some new-product emissions while imposing constraints on insulation, services and performance. These interactions should be quantified for the project rather than assumed.
Rank #4

- AUDIT EVERY CENT & SLASH ELECTRIC BILLS: Stop the guesswork and start saving. By monitoring 18 individual circuits with professional ±1% precision, Refoss Home Energy Monitor shows exactly where your money goes. Identifying “energy vampires”—from HVACs to aging appliances—in real-time helps households effectively reduce monthly utility bills by 10%-20%. This smart power meter is the ultimate tool for electricity consumption audits.
- LOCAL PRIVACY & MULTI-PLATFORM CONTROL: Your home energy data belongs to you, not a cloud server. Featuring a built-in Local Web UI, Open API, and MQTT, and WebSocket, Refoss ensures 100% data privacy. Seamlessly integrate with Home Assistant (via Refoss_RPC) to manage every kWh without cloud reliance or subscription fees. Ideal for a secure electricity monitor with professional local control.
- SMART AUTOMATION & SOLAR ROI OPTIMIZATION: Turn your solar panels into a high-yield investment. Surplus solar and net metering energy can be directed to medium-power appliances like heat pumps, dishwashers, and microwaves, while time-of-use and peak demand energy management ensures maximum solar self-consumption, prevents low-value grid feed-in, and reduces utility bills.
- 5-YEAR DATA ANALYTICS & SMART FAULT ALERTS: Catch appliance failures early before they become expensive repairs. Refoss records minute/hourly/daily/weekly/monthly/yearly usage, with daily data securely stored for 5 years and fully exportable via CSV without any subscription. Receive smart alerts if a fridge or washer consumes unusually high energy, helping you optimize home power usage habits and prevent bill spikes.
- STABLE SIGNAL & EASY SETUP: This system supports Single-phase, Split-phase, and 3-phase 4-wire Wye systems, featuring 2 main sensors (up to 200A) and 16 branch sensors (up to 60A). ETL certified with a 2-year warranty, it includes an external high-gain antenna for enhanced Wi-Fi stability. Most importantly: if a sensor is installed backward, simply flip the reading in the App with one tap—no need to rewire or reopen the live breaker box.
The UK government’s 2025 report focused on England identifies training, standardization, consistent carbon assessments and material-data quality as continuing issues. Designers should therefore state the assessment method, data sources, assumptions, system boundaries and reporting date. When data quality is uncertain, show the uncertainty and test how it affects the decision instead of presenting a false precision.
Independent reader supportYour contribution helps us test, update, and keep practical guides available for everyone.Policy dates are local, not universal
European Union
The European Commission’s recast Energy Performance of Buildings Directive sets EU milestones: new buildings owned by public bodies must meet the EU zero-emission standard from 1 January 2028, and all new buildings from 1 January 2030. These are EU policy dates, not a worldwide construction deadline. National implementation, building categories and transitional provisions determine what a particular project must do.
Quick wins for a faster PC:
Scan for outdated or missing drivers - takes under a minuteDriver Scan →Repair Windows errors before they cause bigger problemsFix Now →England
England’s government work on embodied carbon shows that policy attention extends beyond operational energy. It also highlights the need for consistent methods, training and dependable material data. Designers working in England should check the current planning, building-regulation and reporting requirements for the project’s date and type.
Best Value

- EM16P MODEL & LOCAL CONTROL & DATA PRIVACY: Access your home energy monitor data locally via Built-in Web UI, Open API, and MQTT without relying on cloud services. Unlike cloud-dependent monitors, Refoss ensures your data stays within your home network. Direct local access protects your privacy while giving you 100% full control of your home energy system.
- NATIVE HOME ASSISTANT & OPENCLAW AI: Experience seamless Native Home Assistant integration right out of the box—no firmware flashing or complex coding required. Featuring ✨NEW✨ OpenClaw Support, it enables AI-driven automation for smarter, real-time energy management and seamless smart home control.
- MAXIMIZE SOLAR & ZERO FEED-IN AUTOMATION: Designed for solar homes, the power monitor works with the Refoss app and Home Assistant to automatically use surplus solar power. Appliances like EV chargers, washing machines, and water heaters are powered during midday peaks, maximizing solar self-consumption and reducing low-value electricity feed-in to the grid. Optimizes usage and reduces bills.
- REAL-TIME MONITORING & ±1% ACCURACY: Monitor voltage, current, active power, and power factor of major appliances. Provides ±1% accuracy (200A: 2–200A; 60A: 1–60A) and ±2% at low current. Daily data stored up to 5 years and exportable. With no subscriptions or hidden fees, you get deep historical insights to help you identify every energy-saving opportunity and save 10–20% on monthly bills.
- SMART ALERTS & CIRCUIT-LEVEL CONTROL: Set usage targets for each individual circuit and receive instant alerts when appliances exceed normal consumption. Refoss app supports automation and peak management to optimize schedules, reduce peaks, and improve efficiency. Real-time electricity usage monitor for circuit-level insights.
Australia
Australian commercial-building policy work includes a voluntary pathway in NCC 2025 and investigation of a future minimum standard for NCC 2028. Those references illustrate why a designer should verify the current National Construction Code edition and state or territory requirements rather than importing an EU or English rule.
Evidence from participating design firms
The American Institute of Architects reported in 2026 that 458 firm signatories supplied 2025 program data. Across 24,286 projects, the firms reported a predicted 48% reduction in energy-use intensity, and 427 projects were predicted to be net-zero energy. These figures describe participating firms’ reported program data, not the entire building sector, and “predicted” does not mean verified post-occupancy performance.
The figures are useful as an indication of what firms are modeling and targeting, but they should not be used as a guaranteed outcome for an individual building. Project teams still need a baseline, documented assumptions, commissioning and measured performance.
Common failure modes and practical corrections
- Starting with equipment or panels: Correct the sequence by testing envelope and load-reduction measures first, then size systems and generation for the reduced demand.
- Using annual energy only: Add peak-load analysis so electrical service, heat-pump capacity, storage and district connections are adequate during extreme operating periods.
- Assuming electrification is clean everywhere: Check the local grid mix and seasonal conditions, and disclose any remaining fossil-fuel or backup use.
- Ignoring embodied emissions: Add product production, transport, replacement, demolition and waste to the life-cycle boundary; retain the assumptions and material data used.
- Overlooking controls and handover: Assign commissioning, operator training, trend logging and post-occupancy tuning before construction contracts are finalized.
- Claiming compliance from a broad policy statement: Confirm the jurisdiction, code edition, building category, effective date and any transition rules with the authority having jurisdiction.
- Choosing a shared or district source without verifying access: Obtain evidence of network availability, connection terms, energy sources, capacity and long-term service arrangements.
A concise decision checklist for project teams
- Have passive options been compared for the actual site and climate?
- Are heating, cooling, ventilation, hot-water and lighting loads documented, including peaks?
- Are efficient systems sized from the reduced loads and supported by controls and commissioning?
- Has electrification been checked against grid conditions, electrical capacity and equipment limits?
- Have on-site, nearby, district and grid-delivered clean-energy options been compared on equal boundaries?
- Does the carbon assessment include operational and embodied emissions through demolition and waste?
- Are material data quality, replacement cycles and assessment assumptions transparent?
- Has the team verified the current local code, policy date and connection requirements?
- Is there a plan to measure actual performance and correct underperformance after occupation?
The defensible answer to cleaner-energy design is therefore a sequence, not a gadget: minimize demand, maximize efficiency, electrify appropriate services, use the cleanest practical supply and manage whole-life carbon. The right combination must be selected for the building, site, climate, grid and jurisdiction.
Quick Recap
Product prices and availability are accurate as of the date/time indicated and are subject to change. Any price and availability information displayed on Amazon at the time of purchase will apply.

